


Enbridge Inc Stock (ENB) Moved Up by 3.06% on Aug 20: What Investors Need To Know
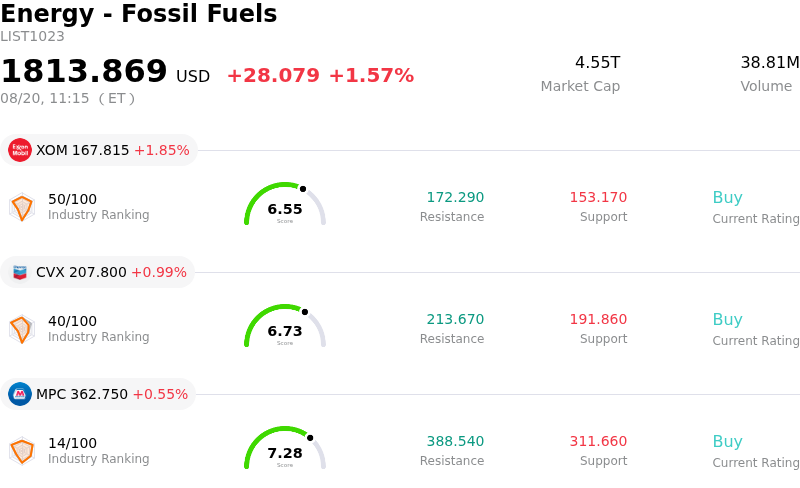
Enbridge Inc (ENB) moved up by 3.06%. The Energy - Fossil Fuels sector is up by 1.57%. The company outperformed the industry. Top 3 stocks by turnover in the sector: Exxon Mobil Corp (XOM) up 1.85%; Chevron Corp (CVX) up 0.99%; Marathon Petroleum Corp (MPC) up 0.55%.
What is driving Enbridge Inc (ENB)’s stock price up today?
Enbridge experienced a strong positive swing during trading, driven by renewed investor appetite for defensive high-yield energy infrastructure assets following a brief market retrenchment. Market sentiment turned decisively bullish as market participants reassessed the company's valuation after a period of sector-wide selling pressure. Institutional and retail buying stepped in to capitalize on the lower entry price, recognizing the disconnect between short-term market fluctuations and the company's underlying operational stability.
Supporting the upward momentum is Enbridge's strong operational execution and robust quarterly financial health. The company recently delivered record adjusted operating profits and reaffirmed its full-year financial guidance, reassuring the investment community about its earnings visibility. Enbridge's utility-like business model—dominated by long-term take-or-pay contracts across natural gas transmission, liquids pipelines, and gas distribution—insulates it from spot commodity volatility. Investors remain encouraged by the firm's expanding secured project backlog, which positions it for consistent multi-year cash flow expansion.
Broader energy industry developments and macro conditions also provided tailwinds for midstream operators. Growing long-term demand for natural gas, driven by power generation requirements from data centers and liquefied natural gas export facilities, enhances the strategic value of Enbridge's infrastructure network. Furthermore, a stabilizing interest rate environment and attractive dividend profile continue to draw institutional inflows looking for reliable yield and defensive growth. Despite persistent capital expenditure demands and leverage considerations, the company's strategic position in North American energy logistics maintains strong market support.
Technical Analysis of Enbridge Inc (ENB)
Technically, Enbridge Inc (ENB) shows a MACD (12,26,9) value of 0.057, indicating a neutral signal. The RSI at 47.505 suggests neutral condition and the Williams %R at 45.039 suggests neutral condition. Please monitor closely.
Fundamental Analysis of Enbridge Inc (ENB)
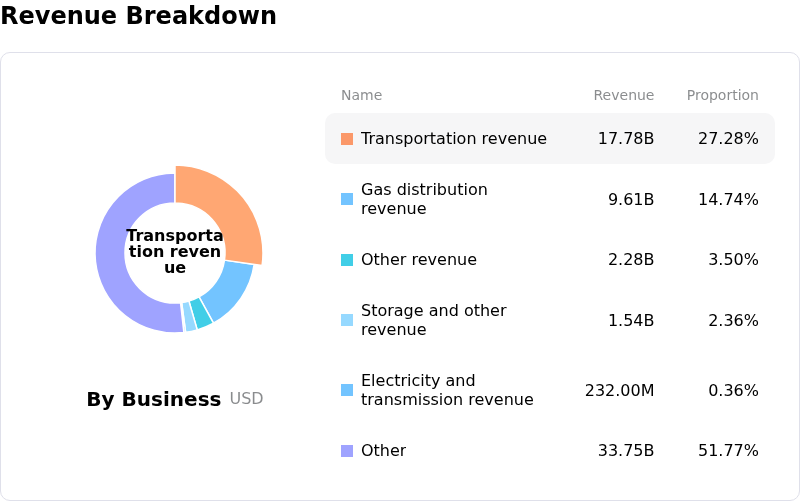
Enbridge Inc (ENB) is in the Energy - Fossil Fuels industry. Its latest annual revenue is $47.83B, ranking 3 in the industry. The net profit is $5.19B, ranking 3 in the industry. Company Profile
Over the past month, multiple analysts have rated the company as Hold, with an average price target of $81.56, a high of $110.78, and a low of $70.00.
More details about Enbridge Inc (ENB)
Company Specific Risks:
- Elevated Debt Leverage and Financing Costs: Enbridge's balance sheet leverage remains elevated at a 5.1x debt-to-EBITDA ratio, leaving minimal cushion for capital execution delays and increasing interest expense burdens while funding its C$41 billion project backlog.
- Mainline Pipeline Volume Disruption Risks: Institutional downgrades highlighted structural concerns that advancing competing pipeline expansion projects could divert crude oil volume from Enbridge's flagship Mainline network, threatening long-term throughput capacity and toll revenue.
- Regulatory Friction and Rate Case Challenges: Ongoing legal and environmental scrutiny surrounding the Line 5 pipeline tunnel project, alongside regulatory pushback during public hearings for proposed utility rate hikes, introduce operational delays and cost-recovery uncertainties.
- Foreign Exchange Drag and Earnings Volatility: With dividends declared in Canadian Dollars and substantial debt held in U.S. Dollars, persistent foreign currency fluctuations create dividend payout variability for international investors while driving GAAP non-cash derivative mark-to-market earnings swings.
Recommended Articles


