


Here's Exactly How Much You'd Need to Invest in SCHD to Generate $500 per Month in Passive Income
Key Points
The Schwab U.S. Dividend Equity ETF offers a yield triple the S&P 500's level, making it popular among income-seeking investors.
The ETF has also historically grown its dividend at a healthy rate.
- 10 stocks we like better than Schwab U.S. Dividend Equity ETF ›
Many investors are using the Schwab U.S. Dividend Equity ETF (NYSEMKT: SCHD) to collect passive income. For example, if you want to generate $500 a month in passive income from this ETF, you'd need to invest $191,800 at the current share price to hit that goal.
The math works out like this. The ETF has a trailing 12-month yield of 3.13% based on the roughly $1.05 per share it has paid out over the past year. At its recent price of around $33.50, you'd need to own 5,725 shares to reach your desired income level of $1,500 per quarter, since this ETF makes quarterly distributions.
Missed Nvidia in 2009? This Rare Signal Is Flashing Again. In 2009, a "Double Down" signal flashed for a little-known chipmaker called Nvidia. For the first time in years, that same "Total Conviction" signal is flashing for a company 1/100th the size of Nvidia. Continue »

Image source: Getty Images.
Building income one month at a time
Most investors don't have $191,800 sitting idle, which might make reaching this monthly income target daunting. However, there are many ways to reach this income level over time, depending on how much you can invest now and each month.
Before we get to those scenarios, it's essential to point out that the Schwab U.S. Dividend Equity ETF isn't just a current yield play. In addition to offering a yield that's triple the market's average (the S&P 500 currently yields around 1%), SCHD has grown its dividend at a compound annual rate of more than 11% since 2017. I'm going to be a little more conservative and assume 9% annual dividend growth.
I modeled three scenarios:
- The income starter: $250 month monthly investment with no lump sum.
- The income builder: A $5,000 initial investment and a recurring $500 monthly investment.
- The income accelerator: A $10,000 lump sum and investing $1,000 a month.
Here's a look at when each scenario would hit the monthly income target, assuming SCHD's share price also rises by 9% annually:
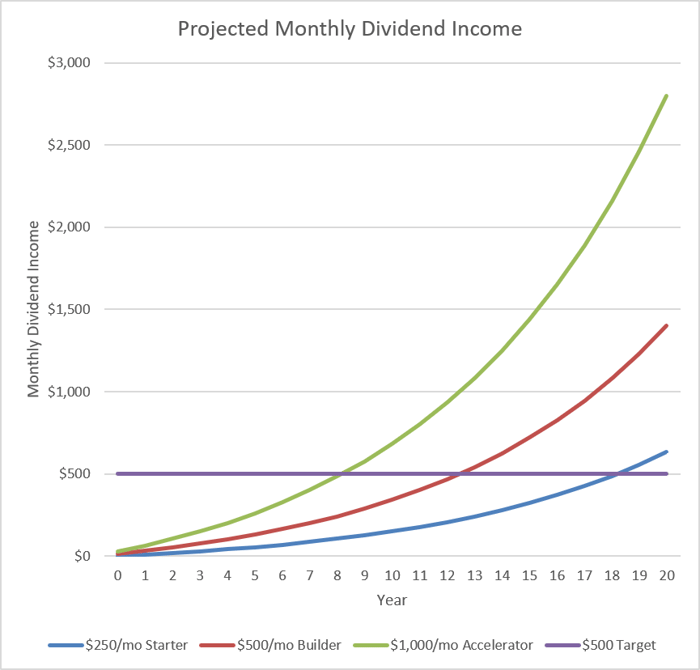
Author's chart and calculations. NOTE: Assumes dividend reinvestment.
Using these assumptions, the income accelerator would reach the target in a little over eight years, while the starter path would take another decade. The bottom line is that SCHD isn't a quick path to income, but one that you can achieve in time.
Should you buy stock in Schwab U.S. Dividend Equity ETF right now?
Before you buy stock in Schwab U.S. Dividend Equity ETF, consider this:
The Motley Fool Stock Advisor analyst team just identified what they believe are the 10 best stocks for investors to buy now… and Schwab U.S. Dividend Equity ETF wasn’t one of them. The 10 stocks that made the cut could produce monster returns in the coming years.
Consider when Netflix made this list on December 17, 2004... if you invested $1,000 at the time of our recommendation, you’d have $419,408!* Or when Nvidia made this list on April 15, 2005... if you invested $1,000 at the time of our recommendation, you’d have $1,348,694!*
Now, it’s worth noting Stock Advisor’s total average return is 966% — a market-crushing outperformance compared to 213% for the S&P 500. Don't miss the latest top 10 list, available with Stock Advisor, and join an investing community built by individual investors for individual investors.
See the 10 stocks »
*Stock Advisor returns as of August 20, 2026.
Matt DiLallo has positions in Schwab U.S. Dividend Equity ETF. The Motley Fool has no position in any of the stocks mentioned. The Motley Fool has a disclosure policy.
Recommended Articles


