


Walmart Earnings Preview: Can Digital Growth Support WMT’s Premium Valuation?
TradingKey - Walmart Inc. (NASDAQ: WMT) expects strong digital sales and higher customer traffic in the upcoming fiscal second quarter, and the growth of its high-margin revenue streams. Walmart's valuation has little room for weak guidance.
Walmart is set to report its fiscal second quarter of 2027 on Thursday, August 20. The retail giant expects a 4 to 5 percent increase in net sales, and an adjusted EPS of $0.72 to $0.74. Analysts project an approximate $186.6 billion in revenue with an adjusted EPS of $0.74. That said, analysts’ estimates are not uniform across the board.
Walmart ended August 18 with a stock price of $115.20, giving it a market cap of approximately $917 billion. Its trailing price to earnings ratio is around 40.6, and typically much higher than its competitors in traditional retail. Walmart will therefore need to showcase clear growth in its e-commerce, advertising, and membership streams in order to justify its valuation.
Customer Traffic Supports Q1 Growth
Walmart reported total revenue of $177.8 billion for the first quarter of the fiscal year 2027, an increase of 7.3 percent year over year. An increase of 7.1 percent was reported for net sales, and an increase of 5 percent was reported for operating income, amounting to $7.49 billion.
Walmart U.S. comparable sales, excluding fuel, increased 4.1 percent. Comparable sales for Sam’s Club U.S. increased 3.9 percent, while net sales for Walmart International increased 10.1 percent in constant currency.
The U.S. growth was more enticing. Transactions increased 3 percent, which was up from last year’s 1.6 percent, while average spending per visit increased 1.1 percent, which was down from last year’s 2.8 percent.
The increase in transactions shows that the growth at Walmart was more indicative of customer visits, rather than an increase in prices. Walmart reported that its U.S. market-share gains were from upper income households.
E-Commerce Economics Continue to Improve
Global sales in Q1 increased by 26%. Walmart US and Sam’s Club US recorded digital growth of 26% and 23% respectively. International e-commerce sales were 27% higher. Store-fulfilled delivery volume has more than doubled in the last two years. More than 36% of the store-fulfilled orders of Walmart US were three-hour delivery orders, positioned during Q1.
Walmart has a logistical advantage with its existing stores across the country. Each store can act as a local fulfillment center for faster delivery without the company requiring a network of e-commerce warehouses.
Automated e-commerce fulfillment centers have reachedabout 50% of Walmart US' total volume. Increased automation could improve digital order processing capacity and profitability.
Advertising and Memberships Improve the Earnings Mix
Global advertising revenue grew 37% in Q1, while Walmart U.S. advertising increased 36%. Walmart Connect itself grew 44%, highlighting the rapid expansion of Walmart’s higher-margin advertising business. These businesses have a lot of potential because they are expected to have higher margins than general merchandise and grocery. Advertising is also expected to grow because it combines Walmart’s customer and transaction data to connect customers with merchants, while members’ fees are expected to generate steady, recurring revenues.
Growth in advertising, memberships, and marketplace commissions is expected to drive operating income at an even faster rate than overall sales. Walmart's relatively higher valuation of shares compared to many of its traditional competitors has a lot to do with the potential of all of these factors.
Consumer Pressure Creates Risks and Opportunities
Consumer health is the biggest concern ahead of Thursday’s report.
In Q1, management noted that U.S. customers, particularly lower-income households, exhibited signs of financial pressure. The average purchase of gas at Walmart stores drops below 10 gallons for first time since 2022. Shoppers have been seeking out sales and purchasing cheaper options.
If that’s the case, Walmart can grab some market share, but there can be pressure on margins because of all the price reductions and increased fuel prices. Rising fuel prices for delivery services hurt Walmart’s Q1 operating income by about $175 million.
The broader environment has weaken too. U.S. retail sales dropped 0.6% in July and gasoline prices were above $4.00/gallon due to renewed U.S.-Iran tensions. All this can support Walmart’s value proposition, but constrain purchases and hike costs.
Capital Spending Weighed on Free Cash Flow
In Q1, free cash flow was -$1.9 billion, while operating cash flow was $4.7 billion.
Walmart is funding automation, supply-chain, tech, and store network capacity investments. Over the next few years, Walmart plans more than 650 U.S. store remodels and 20 new store openings.
Investors want to see the improvements in operating efficiency and better Walmart digital margins from the capital spending.
Guidance Sets a Clear Earnings Test
Walmart maintained its full-year FY2027 outlook for Q1. It expects net sales growth of 3.5-4.5%, adjusted operating income growth of 6-8% currency adjusted and adjusted EPS of $2.75 to $2.85.
For Q2, management expects net sales growth of 4-5%, adjusted operating income growth of 7-10% and adjusted EPS of $0.72 to $0.74.
The August 20 report will be based on five main metrics: U.S. comparable sales, e-commerce growth, advertising revenue, operating margin and full-year guidance. A revenue beat and more optimistic guidance would suggest that Walmart is gaining market share, even in an environment of weakening consumer spending.
WMT Consolidates Below $116.45 Resistance
Walmart appears to be narrowing the range of its price action between descending resistance and bullish support on the two hour chart, trading at about $115.20. After earnings, this may result in a larger price action move.
The nearest price target, or resistance, to be broken is just above at $116.45. Should that level break, targets can be set at $118.07, $119.19, and $120.44.
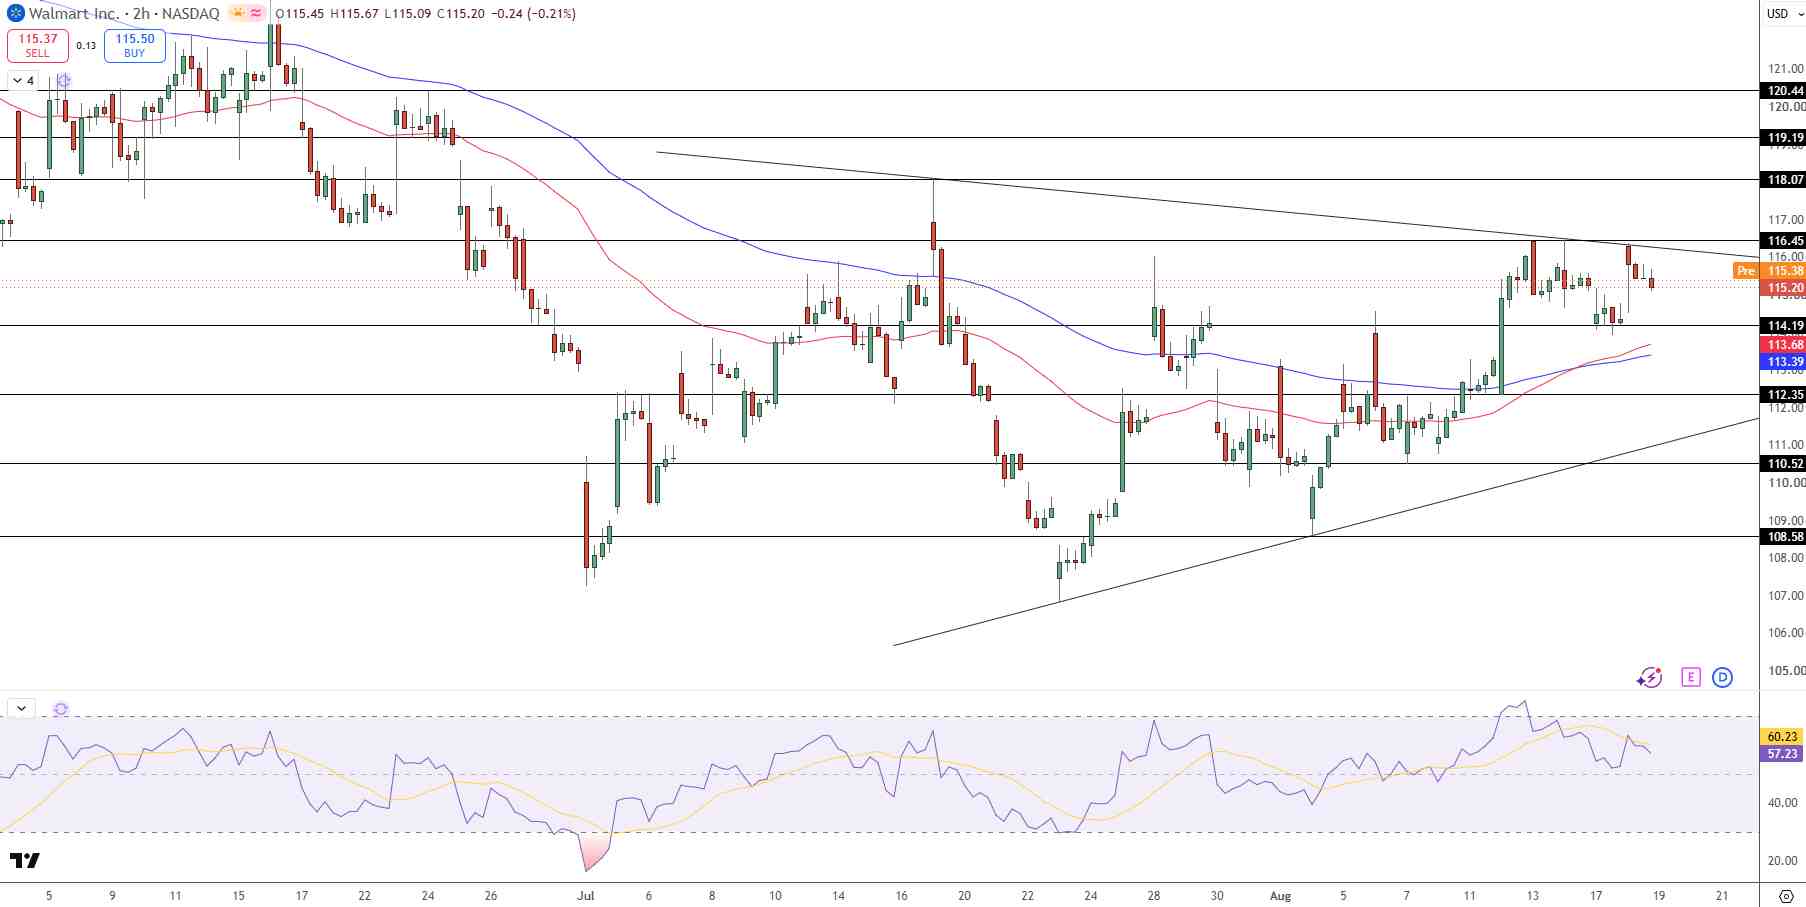
wall Price Chart - Source: Tradingview
Support is at $114.19, with the stock trading around moving averages at $113.68 and $113.39. A move below these two would break the short term bullish structure, and target $112.35 and, subsequently, $110.52.
The RSI read just above 57, and less than half of its value, signal line, at 60. The stock has bullish momentum, but as it nears resistance, that momentum is stalling, again, dependent on the chart provider and indicator settings.
Bottom Line
When comparing to previous reports, Walmart is showing a greater customer interaction and engagement, from the data, showing 26% growth in e-commerce, plus rapid growth in advertising and memberships, which have had a positive impact on revenue.
Consumer spending remains a concern, as well as price volatility and negative free cash flow, all trading at a high earnings valuation of 40. WMT must break $116.45 for a positive short term technical outlook, and dropping below $113.39 would increase risk.
Based on this report, there is evidence to support that Walmart's digital growth and capturing a larger consumer base justifies its high valuation, allowing further valuation until the end of 2026.
This is not an investment report.
Recommended Articles


