


US Treasury yields rise as Oil strength offsets weak Retail Sales
- US 10-year yield rises as Oil strength offsets weak sales.
- Retail Sales contraction weighs on the US Dollar and sentiment.
- Fed December hike bets hold as traders eye PMIs.
US Treasury yields advanced on Friday during the North American session after reversing their course following the release of US Retail Sales data, which disappointed investors. Meanwhile, the lack of news from the Middle East kept Oill prices higher, amid fears of a resumption of hostilities.
US yields climb as Oil stays bid, while weak sales pressure Dollar
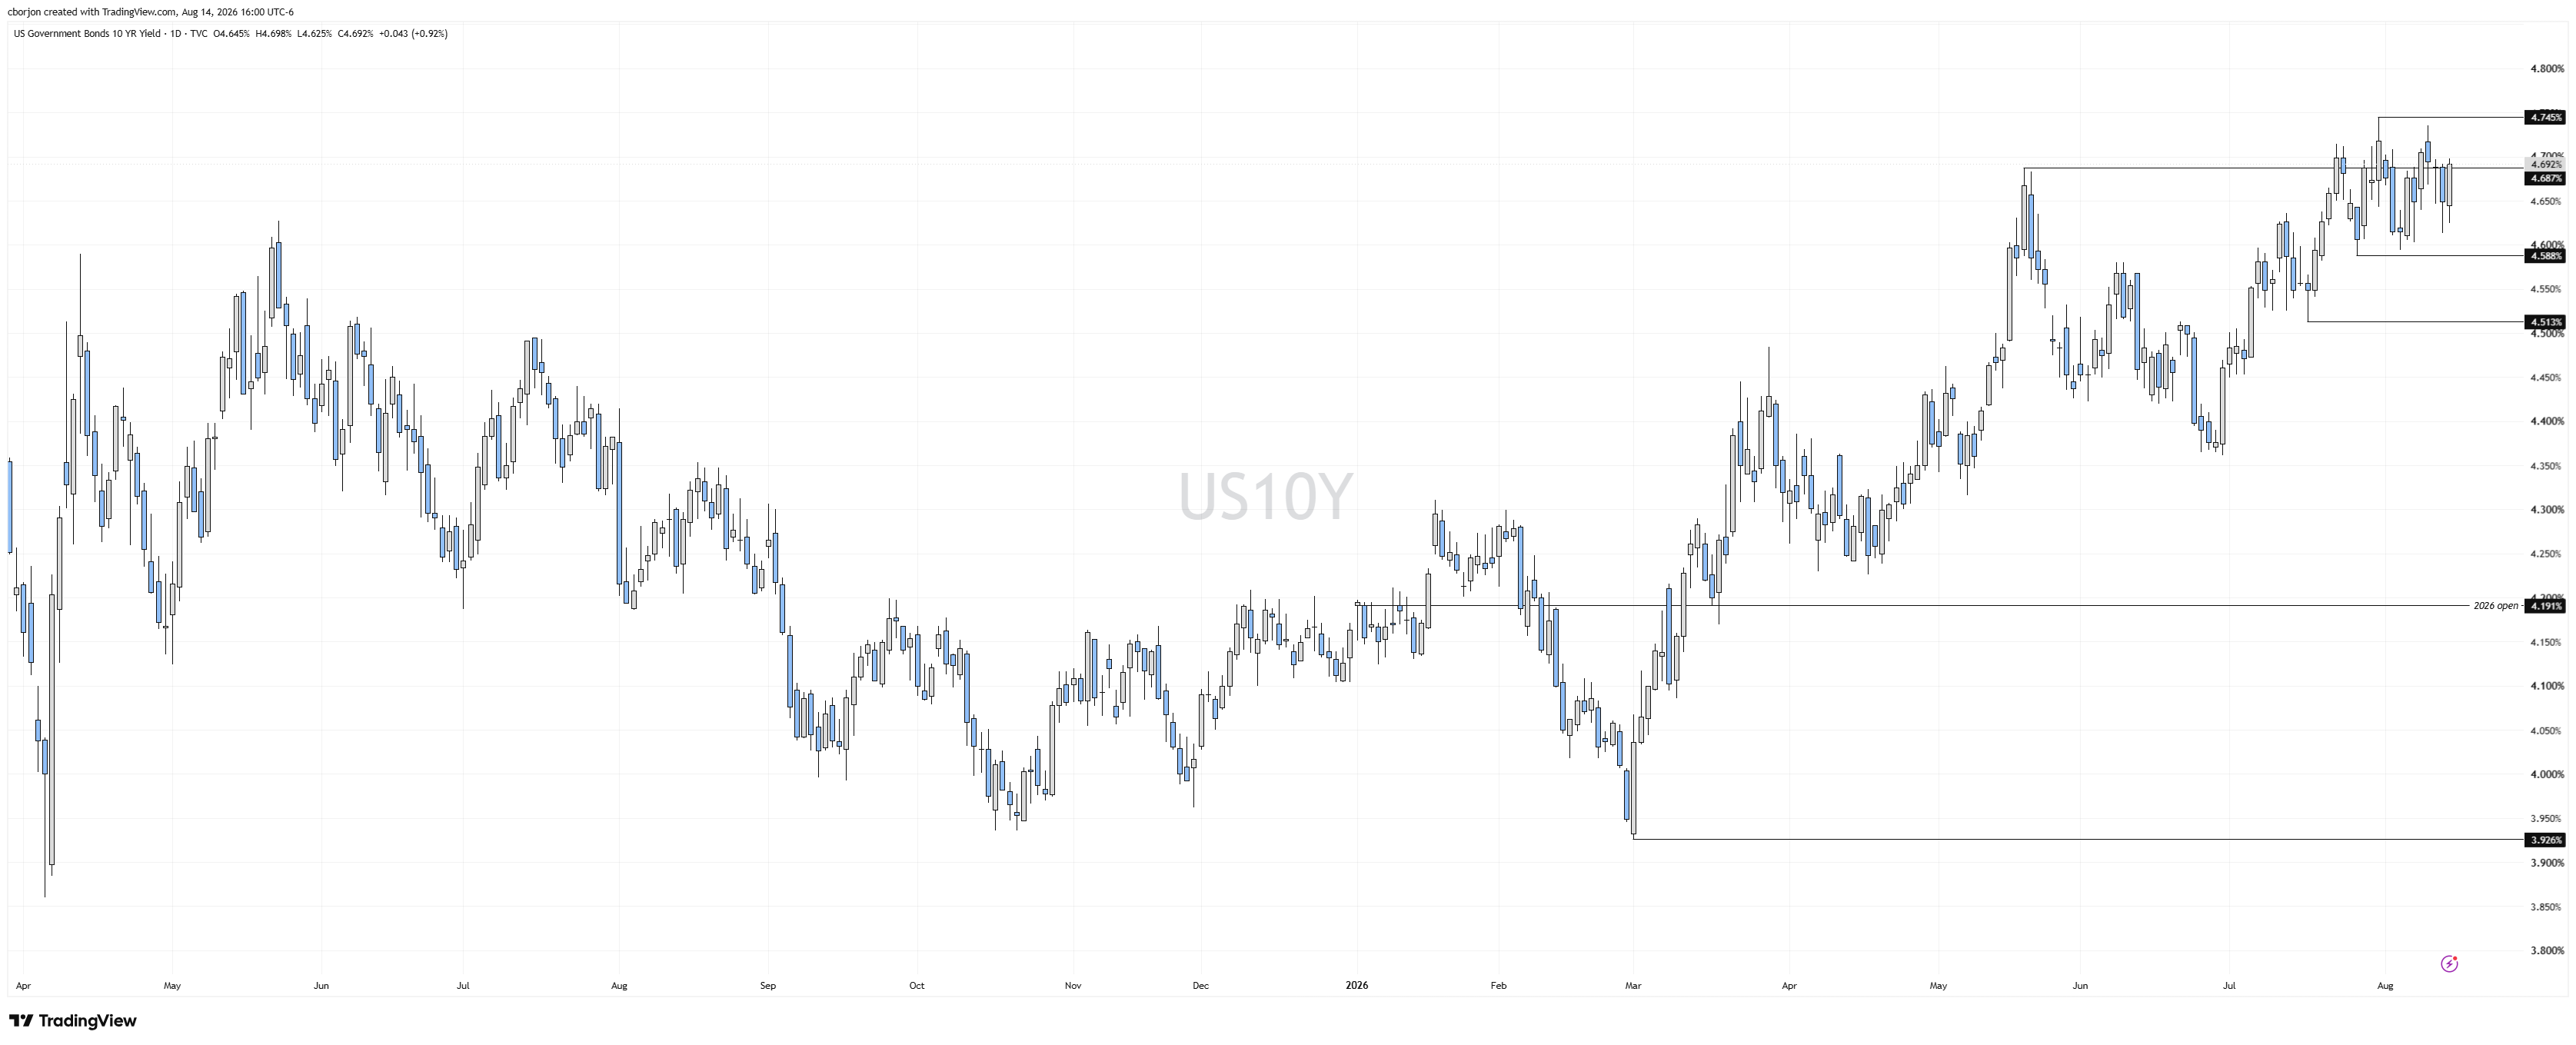
The US 10-year Treasury yield edged up by over 4 basis points to 4.692% amid a rise in Oil prices. West Texas Intermediate (WTI), the US crude benchmark, is up 1.50% at $82.39.
US Retail Sales disappointed investors, contracting -0.6% MoM, below forecasts of 0.1% growth and June’s 0.2%. The decline was spurred by a contraction in online sales, as Amazon moved its Prime Day from July to June. Also, gasoline prices fell.
Later, the University of Michigan Consumer Sentiment index fell from 55.2 to 51.0 in August, showing waning consumer sentiment, while inflation expectations stayed stable.
The US 2-year T-note yield, the most sensitive to interest rate expectations, fell. Before recovering some ground, rising two basis points at 4.17%. So far, money markets have priced in a 63% chance of a rate hike by the Fed at the December 2026 meeting.
The US Dollar Index (DXY), which tracks the performance of the buck’s value against six currencies, tumbled over 0.31% at 99.63, and for the week is poised to end almost flat.
The US docket will include housing data, the ADP Employment Change 4-week average, jobless claims, and Flash PMIs.
US 10-year Treasury yield chart
Interest rates FAQs
Interest rates are charged by financial institutions on loans to borrowers and are paid as interest to savers and depositors. They are influenced by base lending rates, which are set by central banks in response to changes in the economy. Central banks normally have a mandate to ensure price stability, which in most cases means targeting a core inflation rate of around 2%. If inflation falls below target the central bank may cut base lending rates, with a view to stimulating lending and boosting the economy. If inflation rises substantially above 2% it normally results in the central bank raising base lending rates in an attempt to lower inflation.
Higher interest rates generally help strengthen a country’s currency as they make it a more attractive place for global investors to park their money.
Higher interest rates overall weigh on the price of Gold because they increase the opportunity cost of holding Gold instead of investing in an interest-bearing asset or placing cash in the bank. If interest rates are high that usually pushes up the price of the US Dollar (USD), and since Gold is priced in Dollars, this has the effect of lowering the price of Gold.
The Fed funds rate is the overnight rate at which US banks lend to each other. It is the oft-quoted headline rate set by the Federal Reserve at its FOMC meetings. It is set as a range, for example 4.75%-5.00%, though the upper limit (in that case 5.00%) is the quoted figure. Market expectations for future Fed funds rate are tracked by the CME FedWatch tool, which shapes how many financial markets behave in anticipation of future Federal Reserve monetary policy decisions.
Recommended Articles


