


Webster Financial Corp Stock (WBS) Closed Down by 100.00% on Oct 19: Drivers Behind the Movement
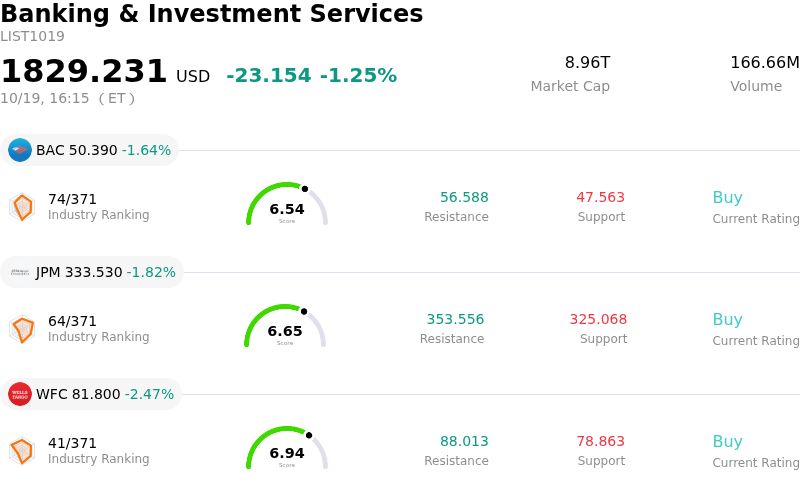
Webster Financial Corp (WBS) closed down by 100.00%. The Banking & Investment Services sector is down by 1.25%. The company underperformed the industry. Top 3 stocks by turnover in the sector: Bank of America Corp (BAC) down 1.64%; JPMorgan Chase & Co (JPM) down 1.82%; Wells Fargo & Co (WFC) down 2.47%.
What is driving Webster Financial Corp (WBS)’s stock price down today?
The terminal shift in public market activity for Webster Financial Corporation stems from the final completion of its acquisition by Banco Santander and the formal delisting of its common stock from the New York Stock Exchange. Following the receipt of all required regulatory approvals from federal banking authorities and international bodies, the corporate transaction reached its definitive closing phase. In accordance with the transaction agreement, public trading of the equity was suspended, and the company initiated deregistration procedures under federal securities regulations.
From an institutional research standpoint, this structural movement reflects the execution of a definitive corporate buyout rather than fundamental financial deterioration, credit stress, or operational underperformance. As part of the definitive transaction structure, public equity shares were retired from secondary market exchanges and converted or settled into the designated merger consideration for existing shareholders.
Moving forward, Webster Bank's underlying commercial banking, consumer banking, and health savings account operations are being integrated into Santander's broader North American banking platform. Consequently, ongoing financial performance, loan portfolio quality, and capital adequacy metrics will no longer be tracked via an independent publicly traded vehicle, as corporate governance and operational oversight transfer entirely to the acquiring entity.
Technical Analysis of Webster Financial Corp (WBS)
Technically, Webster Financial Corp (WBS) shows a MACD (12,26,9) value of -0.231, indicating a neutral signal. The RSI at 51.778 suggests neutral condition and the Williams %R at 64.112 suggests sell condition. Please monitor closely.
Fundamental Analysis of Webster Financial Corp (WBS)
Webster Financial Corp (WBS) is in the Banking & Investment Services industry. Its latest annual revenue is $2.85B, ranking 69 in the industry. The net profit is $974.86M, ranking 50 in the industry. Company Profile
Over the past month, multiple analysts have rated the company as , with an average price target of $76.29, a high of $77.00, and a low of $75.00.
More details about Webster Financial Corp (WBS)
Company Specific Risks:
- Acquisition Completion and Settlement Risk: Following Banco Santander's cross-border transaction to acquire Webster Financial, equity holders face arbitrage volatility and execution risks surrounding final shareholder settlement and share conversions into Santander ADSs.
- Institutional Downgrades and Capped Valuation: Multiple Wall Street firms downgraded WBS to Neutral and Sell ratings, citing capped price appreciation relative to the fixed transaction value and limited remaining upside potential.
- Net Interest Margin Compression: Operational performance remains under pressure from top-line headwinds, highlighted by net interest income falling short of consensus expectations due to elevated funding costs and narrowing net interest margins.
- Commercial Real Estate Portfolio Exposure: Persistent credit risk concentration within regional commercial real estate (CRE) loan portfolios, specifically rent-regulated properties, exposes the bank to elevated credit loss provisions and potential loan impairment.
Recommended Articles


