


United States Dollar Index trades flat at the start of the US NFP week
- The US Dollar Index trades flat at around 101.10 in the opening session on Monday.
- Investors will pay close attention to the US NFP data this week.
- Oil prices gain as US President Trump keeps the possibility of military action with Iran alive.
The US Dollar (USD) reflects a flat performance at the start of the week. In the Asian trade, the US Dollar Index (DXY), which gauges the Greenback’s value against six major currencies, trades calmly at around 101.10.
The US Dollar is expected to remain volatile this week as a slew of United States (US) economic data is scheduled to be published this week, notably the Nonfarm Payrolls (NFP) data for September, which will be released on Friday. Other key notable releases are JOLTS Job Opening and Personal Consumption Expenditure (PCE) Price Index data for August, and ADP Employment Change and ISM Manufacturing PMI data for September.
The US NFP data is expected to the key driver of Federal Reserve (Fed) interest rate expectations. Currently, the CME FedWatch tool shows an almost 68% chance that the Fed will hike interest rates again in the October policy meeting.
In the September meeting, the Fed hiked interest rates by 25 basis points (bps) to the 3.75%-4.00% range and signaled at least one more in the remainder of the year.
On the global front, oil prices trade higher as US President Donald Trump underpins fears of military action with Iran. Trump said on Sunday that he believes the war with Iran will be won “very soon,” adding that additional military strikes before the midterm elections are possible, Fox News reported.
US Dollar Index Technical Analysis
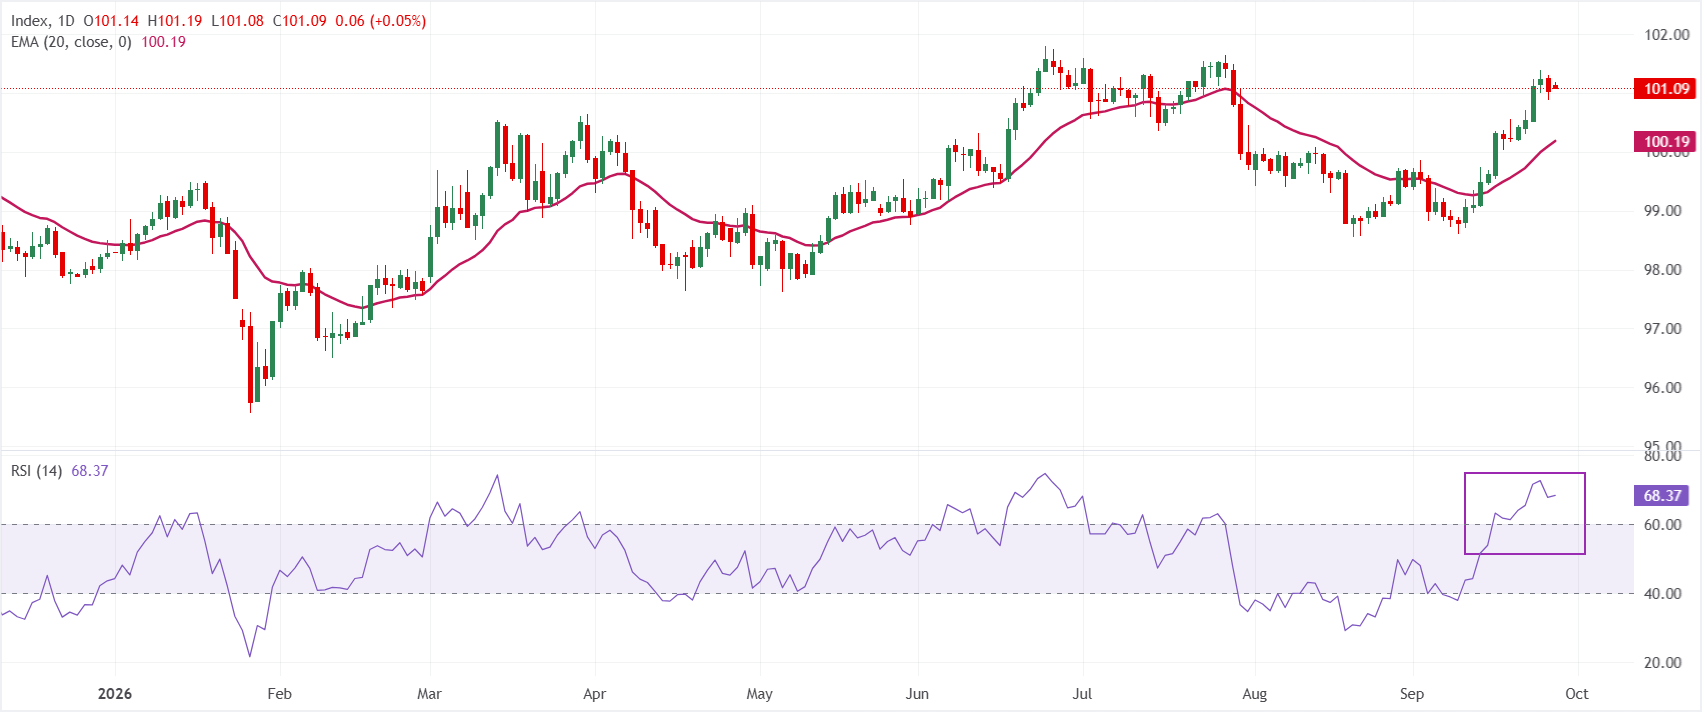
In the daily chart, Dollar Index Spot trades at 101.09. The near-term bias is bullish as price holds above the 20-day exponential moving average (EMA) at 100.19, reinforcing a constructive underlying trend. The Relative Strength Index (14) at 68.36 approaches overbought territory, hinting that upside momentum is strong but could be at risk of a short-term pause or consolidation.
On the downside, immediate support is seen at the 20-day EMA around 100.19, which protects the recent advance and would need to give way to signal a deeper correction. With no nearby technical resistance levels in the current dataset, the index retains scope to extend higher in the near term, though stretched RSI readings suggest fresh gains may be more measured.
(The technical analysis of this story was written with the help of an AI tool. Know more.)
US Dollar FAQs
The US Dollar (USD) is the official currency of the United States of America, and the ‘de facto’ currency of a significant number of other countries where it is found in circulation alongside local notes. It is the most heavily traded currency in the world, accounting for over 88% of all global foreign exchange turnover, or an average of $6.6 trillion in transactions per day, according to data from 2022. Following the second world war, the USD took over from the British Pound as the world’s reserve currency. For most of its history, the US Dollar was backed by Gold, until the Bretton Woods Agreement in 1971 when the Gold Standard went away.
The most important single factor impacting on the value of the US Dollar is monetary policy, which is shaped by the Federal Reserve (Fed). The Fed has two mandates: to achieve price stability (control inflation) and foster full employment. Its primary tool to achieve these two goals is by adjusting interest rates. When prices are rising too quickly and inflation is above the Fed’s 2% target, the Fed will raise rates, which helps the USD value. When inflation falls below 2% or the Unemployment Rate is too high, the Fed may lower interest rates, which weighs on the Greenback.
In extreme situations, the Federal Reserve can also print more Dollars and enact quantitative easing (QE). QE is the process by which the Fed substantially increases the flow of credit in a stuck financial system. It is a non-standard policy measure used when credit has dried up because banks will not lend to each other (out of the fear of counterparty default). It is a last resort when simply lowering interest rates is unlikely to achieve the necessary result. It was the Fed’s weapon of choice to combat the credit crunch that occurred during the Great Financial Crisis in 2008. It involves the Fed printing more Dollars and using them to buy US government bonds predominantly from financial institutions. QE usually leads to a weaker US Dollar.
Quantitative tightening (QT) is the reverse process whereby the Federal Reserve stops buying bonds from financial institutions and does not reinvest the principal from the bonds it holds maturing in new purchases. It is usually positive for the US Dollar.
Recommended Articles


