


Dow Jones Industrial Average falls a third day as bond yields climb
- DJIA closes at its lowest since mid-June, its third straight losing session.
- The 30-year US Treasury yield hit 5.50%, its highest since June 2004.
The 30-year Treasury yield touched 5.50% on Thursday, and two Fed officials gave bond buyers no reason to expect relief. New York Fed President Williams said another rate increase this year looks reasonable, and Philadelphia Fed President Paulson said rates may need to rise a little more. Sherwin-Williams (SHW), which sells paint into a housing market priced off long-term rates, was among the Dow's three biggest losers with Walmart (WMT) and International Business Machines (IBM).
Stocks came off their lows after Reuters reported that US and Iranian negotiators are discussing a phased deal to reopen the Strait of Hormuz. Brent still finished above $106 a barrel, up on the day, on a report that tankers may soon be able to use the strait again.
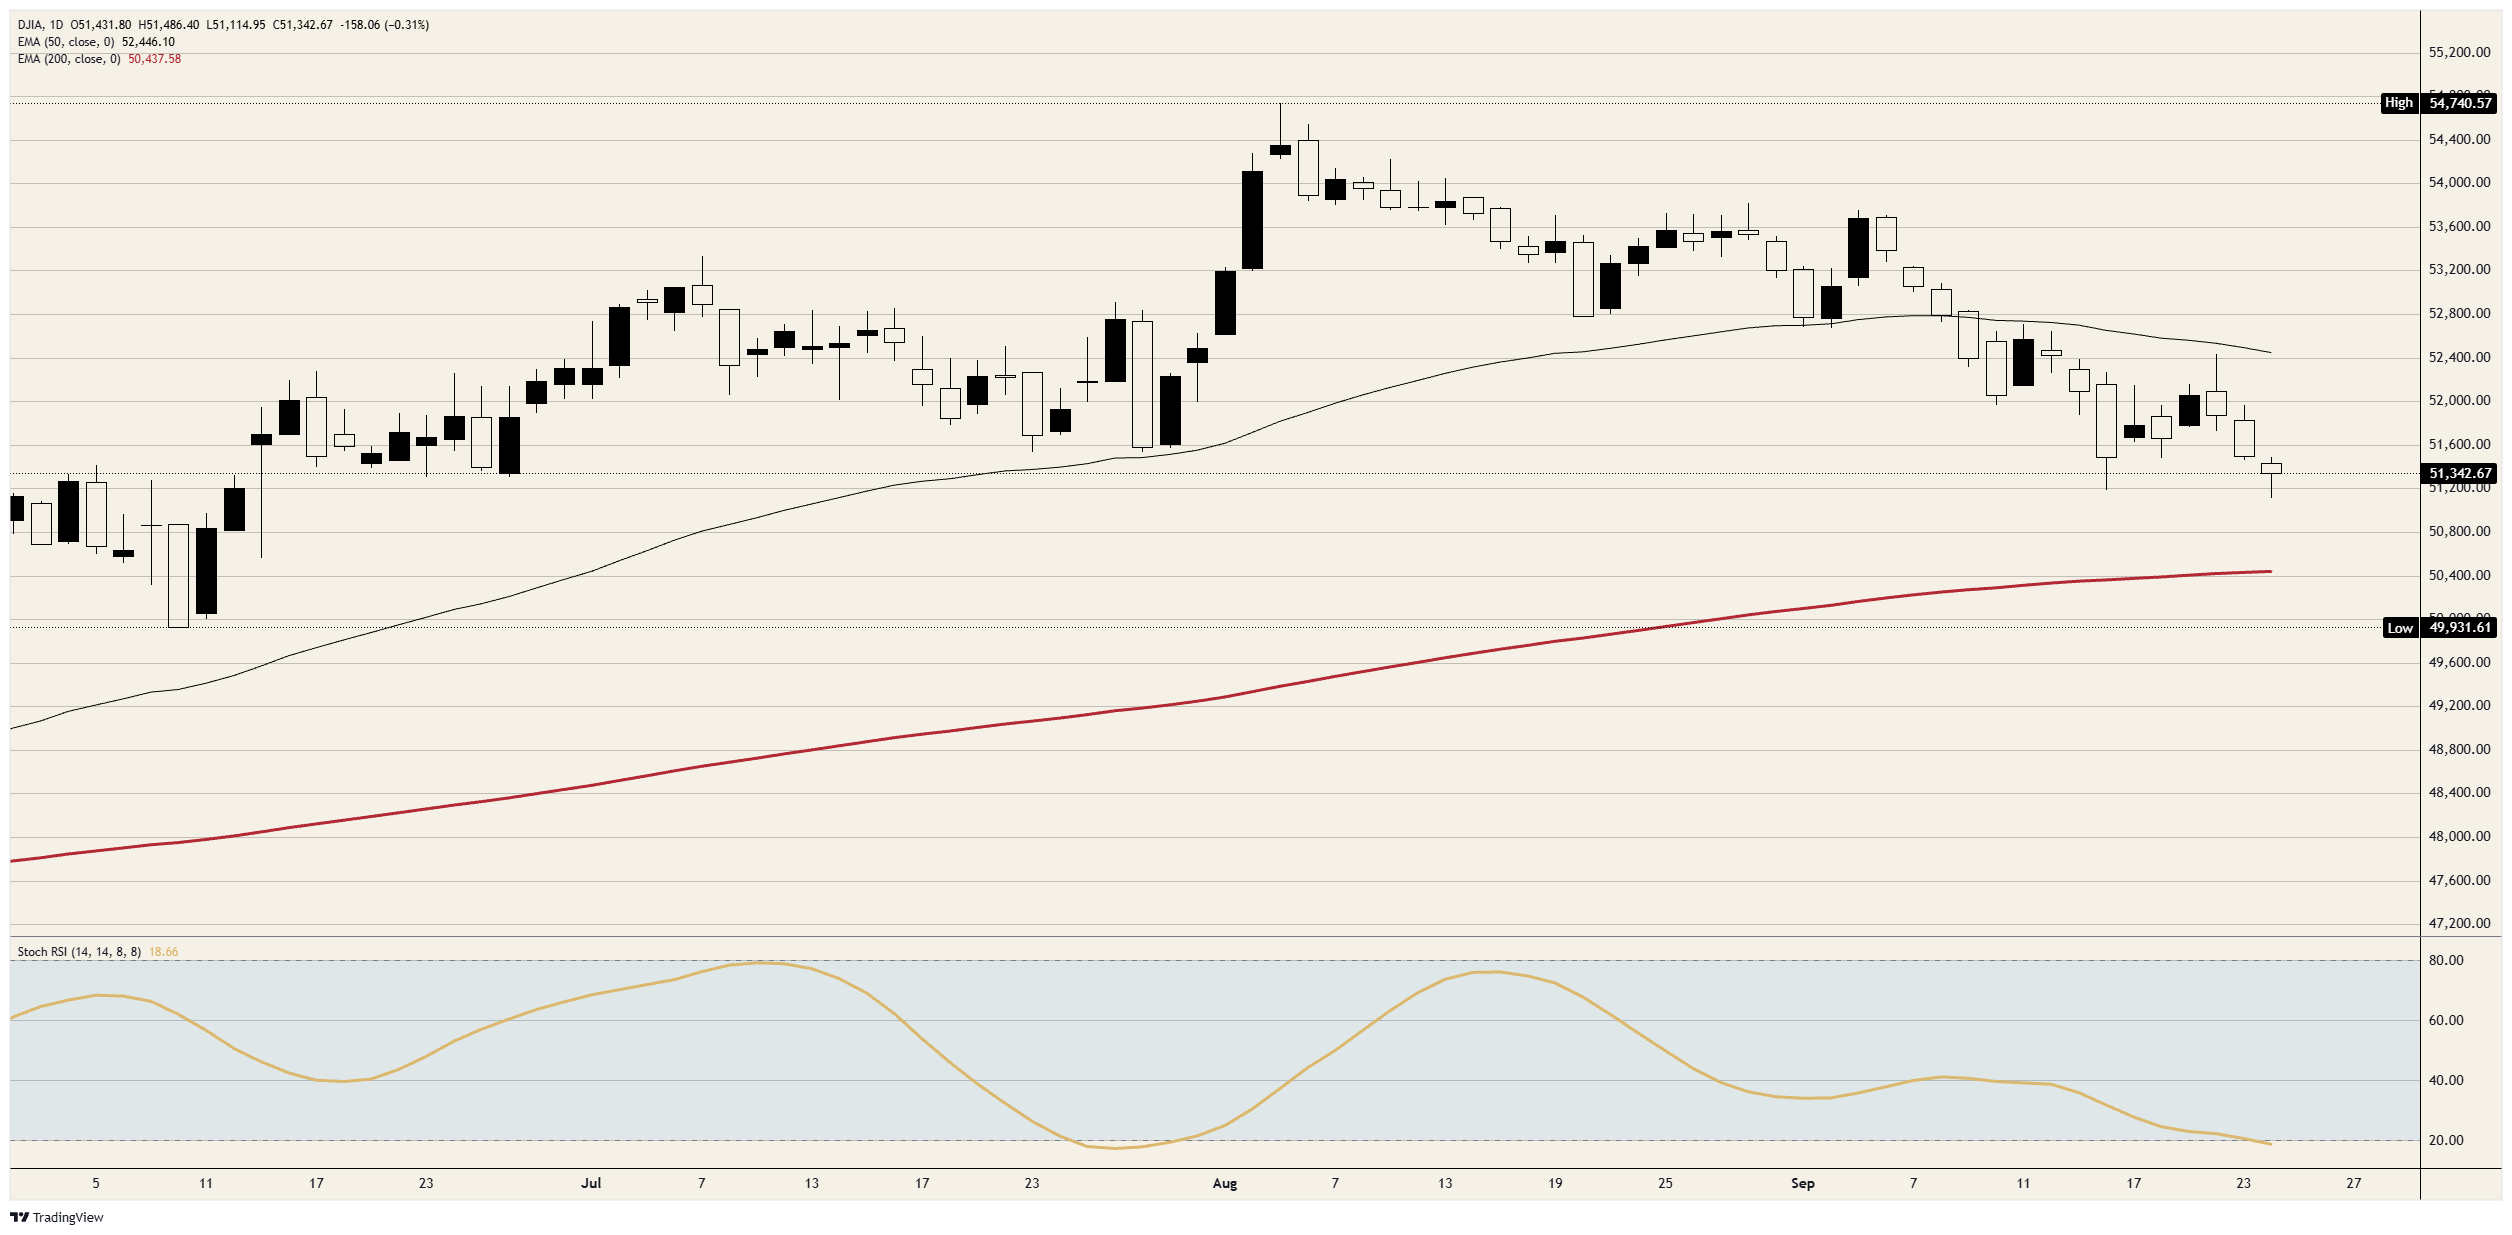
The index closed at its lowest since mid-June after dipping to the 51,100 area, beneath the September 16 low near 51,200. It has now given back about 70% of the June-to-August rally that peaked near 54,750. The S&P 500 finished flat and the Nasdaq Composite edged higher, so the Dow was the only one of the three to fall. It ended the day well below its 50-day moving average, a smoothed line of recent closes near 52,500 that has stayed above the index since the second week of September. The daily Stochastic Relative Strength Index (Stoch RSI), a momentum gauge, fell under 20 for the first time since late July.
Dow Jones daily chart
Dow Jones FAQs
The Dow Jones Industrial Average, one of the oldest stock market indices in the world, is compiled of the 30 most traded stocks in the US. The index is price-weighted rather than weighted by capitalization. It is calculated by summing the prices of the constituent stocks and dividing them by a factor, currently 0.152. The index was founded by Charles Dow, who also founded the Wall Street Journal. In later years it has been criticized for not being broadly representative enough because it only tracks 30 conglomerates, unlike broader indices such as the S&P 500.
Many different factors drive the Dow Jones Industrial Average (DJIA). The aggregate performance of the component companies revealed in quarterly company earnings reports is the main one. US and global macroeconomic data also contributes as it impacts on investor sentiment. The level of interest rates, set by the Federal Reserve (Fed), also influences the DJIA as it affects the cost of credit, on which many corporations are heavily reliant. Therefore, inflation can be a major driver as well as other metrics which impact the Fed decisions.
Dow Theory is a method for identifying the primary trend of the stock market developed by Charles Dow. A key step is to compare the direction of the Dow Jones Industrial Average (DJIA) and the Dow Jones Transportation Average (DJTA) and only follow trends where both are moving in the same direction. Volume is a confirmatory criteria. The theory uses elements of peak and trough analysis. Dow’s theory posits three trend phases: accumulation, when smart money starts buying or selling; public participation, when the wider public joins in; and distribution, when the smart money exits.
There are a number of ways to trade the DJIA. One is to use ETFs which allow investors to trade the DJIA as a single security, rather than having to buy shares in all 30 constituent companies. A leading example is the SPDR Dow Jones Industrial Average ETF (DIA). DJIA futures contracts enable traders to speculate on the future value of the index and Options provide the right, but not the obligation, to buy or sell the index at a predetermined price in the future. Mutual funds enable investors to buy a share of a diversified portfolio of DJIA stocks thus providing exposure to the overall index.
Recommended Articles


