

US September PPI Far Exceeds Expectations, Heating Inflation and Hitting Markets as Bitcoin Retests $80,000

Source Tradingkey

TradingKey - US September PPI data heats up unexpectedly, Bitcoin slides as key $80,000 defense line comes under pressure.

On October 15, the U.S. Bureau of Labor Statistics (BLS) officially released the latest September 2026 Producer Price Index (PPI) data. Bitcoin (BTC) price came under pressure, retesting the $80,000 mark and trading at $80,781.
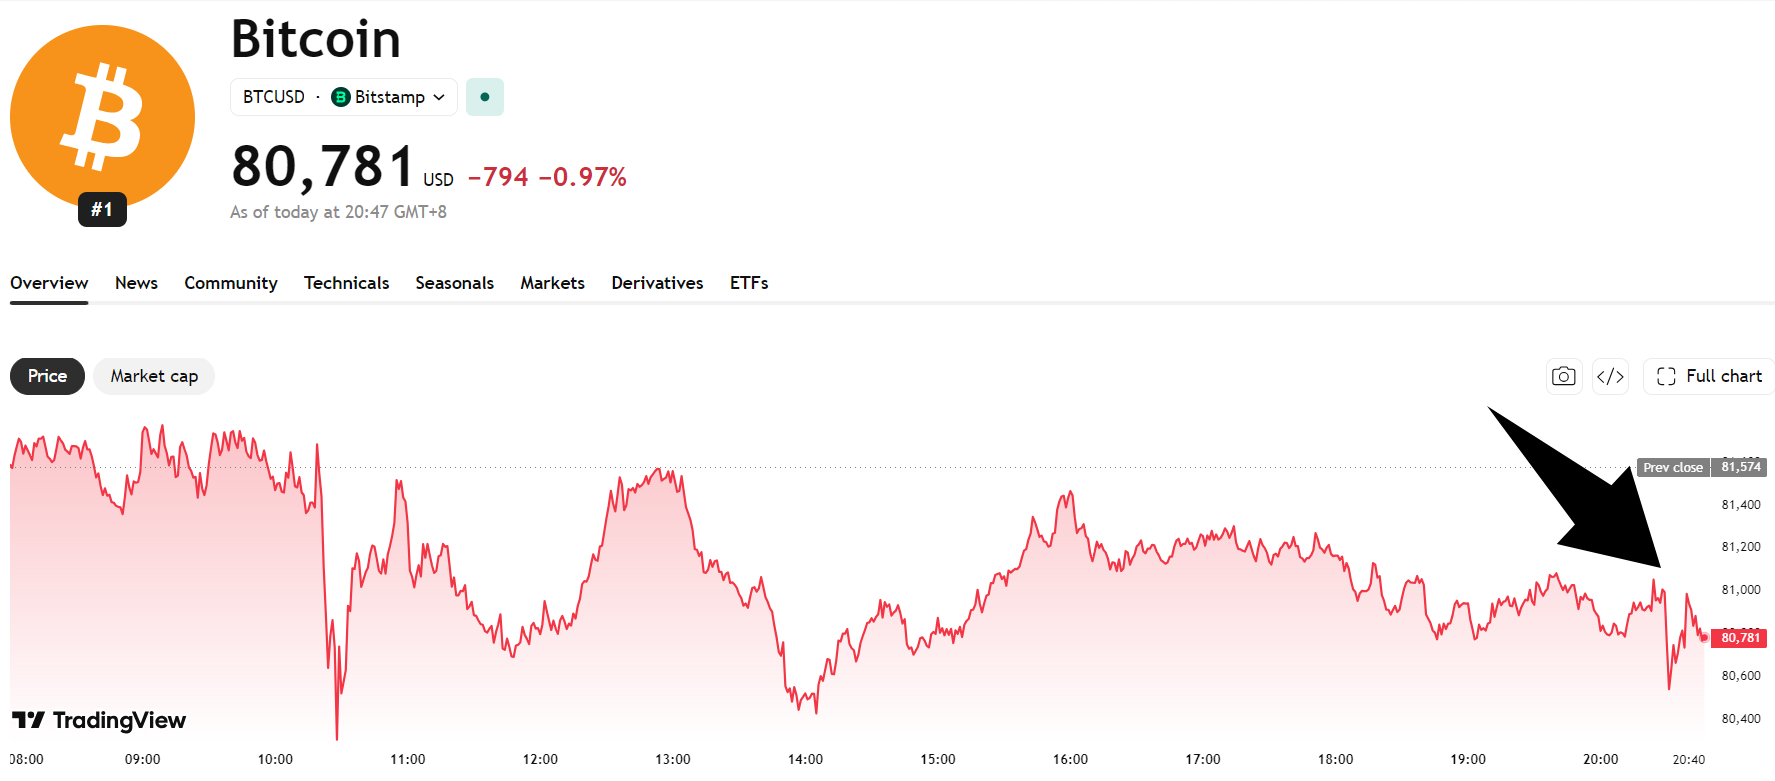
bitcoin-btc-price-e0ad507d68d64b6fb8883eeed9ac6d7aBitcoin price chart, Source: TradingView

Following yesterday's release of the CPI showing YoY growth rising to 3.7%, the PPI—a leading upstream inflation indicator—rebounded dramatically and significantly above expectations, confirming that corporate production cost pressures are accelerating down the supply chain. Details are as follows:

Inflation Indicator (PPI)

Actual Data

Wall Street Estimate

August Prior

Headline PPI MoM

+1.3%

+0.5% – +0.6%

+0.4%

Headline PPI YoY

6.3%

5.3%

5.4%

Core PPI MoM

+0.5% – +0.6%

+0.3%

+0.2%

Core PPI YoY

5.0%

4.4%

4.6%

This double blow of both PPI and CPI exceeding expectations represents a major market liquidation of derivatives leverage triggered by a macro inflation surprise. Although short-term sentiment is extremely pessimistic, long-term Bitcoin holders' on-chain positions have not seen large-scale capitulation, and Bitcoin's price has not yet broken below the key $80,000 level.

Looking ahead, if BTC shows right-side bullish reversal signals near $80,000—such as declining volume bottoming or lower shadow engulfing patterns—it will provide an attractive window for dollar-cost averaging into Q4 positions. However, if a second wave of panic selling causes a decisive break below $80,000, it could seek support lower in the $74,000–$75,000 range.
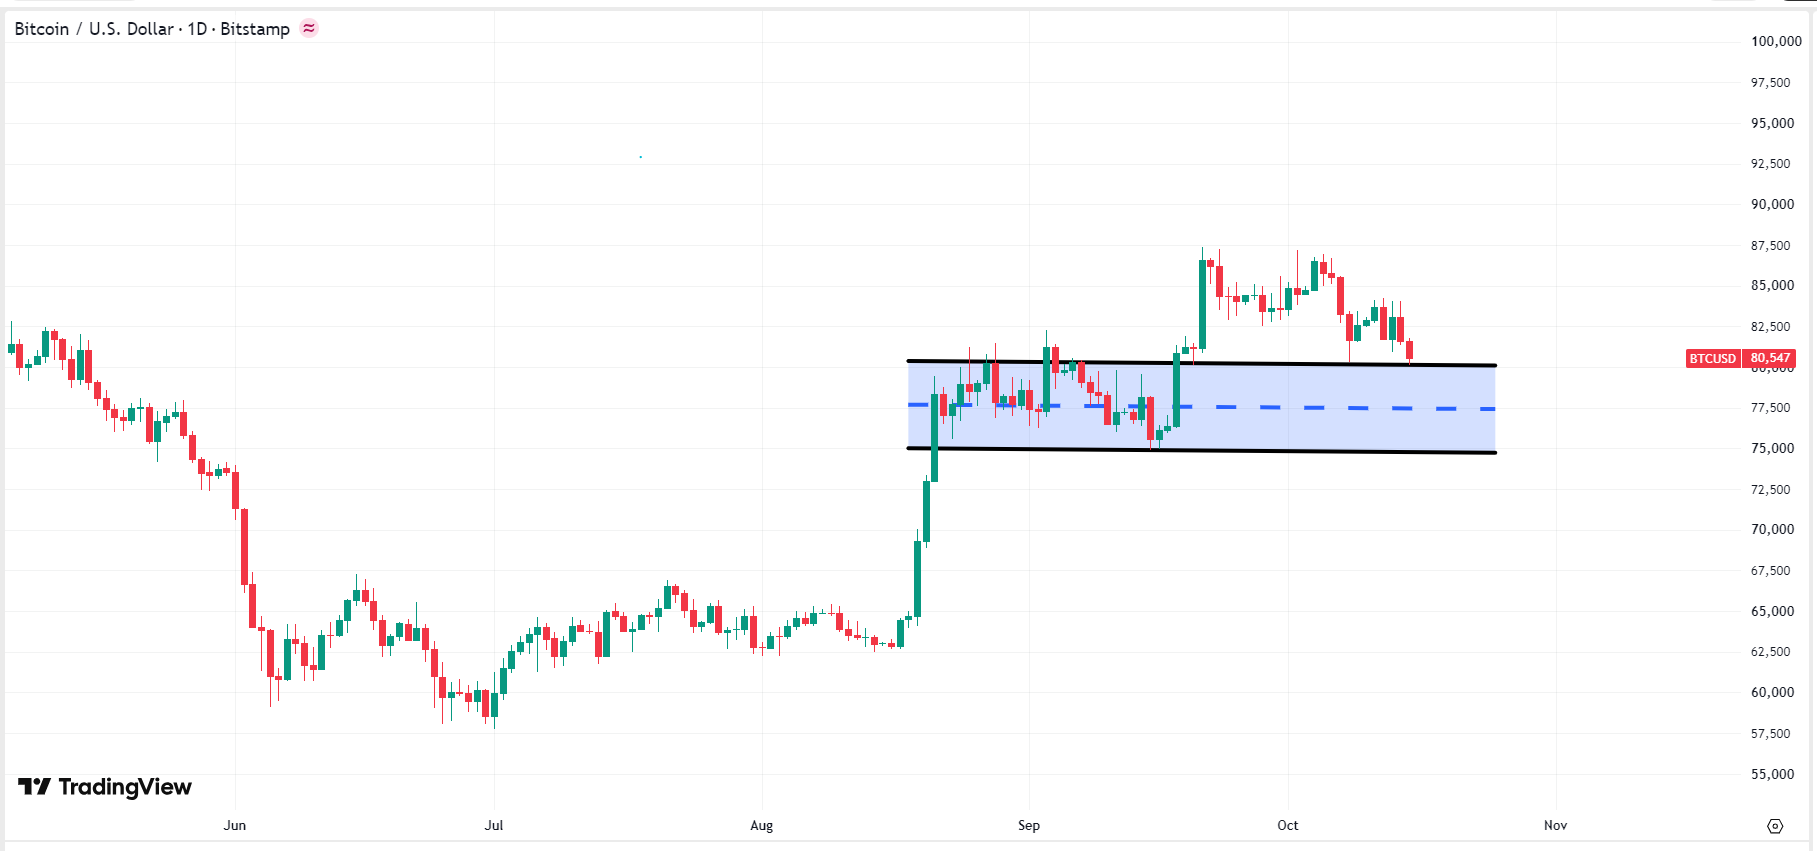
bitcoin-btc-etf-ee4a503ae2374010af1b1d746cc551baBitcoin price chart, Source: TradingView

Disclaimer: For information purposes only. Past performance is not indicative of future results.
placeholder
XRP Price Prediction for July 2026: Can Buyers Finally Break the Downtrend?XRP (XRP) price trades near $1.05, caught between a year-long downtrend and a sudden burst of buying.July has historically rewarded XRP holders. This year the month arrives with on-chain accumulation
Author  Beincrypto
Jun 30, Tue
XRP (XRP) price trades near $1.05, caught between a year-long downtrend and a sudden burst of buying.July has historically rewarded XRP holders. This year the month arrives with on-chain accumulation
placeholder
Smart Money is Leaving Nvidia for This AI Chip StockNvidia stock price keeps sliding, yet the usual dip buyers are missing. Institutional money flow on the stock is the most negative of any major chip name, which means big investors are stepping back i
Author  Beincrypto
Jun 30, Tue
Nvidia stock price keeps sliding, yet the usual dip buyers are missing. Institutional money flow on the stock is the most negative of any major chip name, which means big investors are stepping back i
placeholder
XAUUSD Gold Analysis: Gold Holds Above $4,350 Ahead of US Inflation Data Is $4,500 Next? Gold holds above $4,350 following weak US jobs data. As inflation reports approach and UBS eyes $5,000, can XAUUSD break resistance at $4,435 to rally toward $4,500?
Author  Naoufal Seddik
Aug 12, Wed
Gold holds above $4,350 following weak US jobs data. As inflation reports approach and UBS eyes $5,000, can XAUUSD break resistance at $4,435 to rally toward $4,500?
placeholder
Gold Price Analysis Today: Gold Drops 1.32% Despite Lower Fed Rate-Hike Bets, Can $4,313 Support Hold? Gold fell 1.32% on August 13 after rising to $4,449.73, then reversing lower and closing near $4,349.918 below the $4,356.46 support. Softer US inflation data reduced Fed rate hike expectations, but selling pressure still dominated the session. Will $4,313 support hold?
Author  Naoufal Seddik
Aug 14, Fri
Gold fell 1.32% on August 13 after rising to $4,449.73, then reversing lower and closing near $4,349.918 below the $4,356.46 support. Softer US inflation data reduced Fed rate hike expectations, but selling pressure still dominated the session. Will $4,313 support hold?
placeholder
Gold Price Analysis Today: Gold Gains 0.94% as Markets Expect Fed to Hold Rates, Can $4,449 Resistance Break? Gold gained 0.94% on August 17, closing near $4,417.30 as softer US data strengthened expectations for unchanged Fed rates in September. Gold remains bullish, with $4,449.730 resistance and $4,310.650 support in focus.
Author  Naoufal Seddik
Aug 18, Tue
Gold gained 0.94% on August 17, closing near $4,417.30 as softer US data strengthened expectations for unchanged Fed rates in September. Gold remains bullish, with $4,449.730 resistance and $4,310.650 support in focus.
goTop
quote