


CME vs. Coinbase Global: Which Financial Stock Is a Better Buy in 2026?
Key Points
CME Group operates a high-margin derivatives marketplace with a net margin of 62% in fiscal 2025.
Coinbase Global has rapidly scaled its ecosystem to reach close to $7.2 billion in annual revenue.
Which financial giant is the better buy for your portfolio in 2026?
- 10 stocks we like better than CME Group ›
The battle for financial infrastructure is heating up as traditional exchanges and crypto platforms collide. Investors must choose between the steady stability of CME Group (NASDAQ:CME) and the high-growth volatility of Coinbase Global (NASDAQ:COIN).
CME Group operates the world's largest derivatives marketplace, providing essential risk management tools for global institutions. Coinbase Global serves as the primary gateway for retail and institutional crypto trading. While both companies benefit from market volume, they operate in distinct regulatory environments, offering different profiles for growth and risk.
The case for CME
CME Group operates as a central hub for global derivatives trading, selling contracts that allow clients to manage price risks. Its marketplace covers major asset classes including interest rates, energy, and agricultural products. The company maintains exclusive license agreements with S&P Global (NYSE:SPGI) and Nasdaq (NASDAQ:NDAQ) for popular index products.
Strategic partnerships also drive its expansion into new technology and retail spaces. The exchange maintains a 10-year technology migration agreement with Alphabet (NASDAQ:GOOGL) (NASDAQ:GOOG) for its cloud infrastructure. Additionally, a joint venture with Flutter Entertainment (NYSE:FLUT) subsidiary FanDuel provides prediction markets for retail customers.
In its latest annual report, filed for fiscal 2025, revenue reached nearly $6.5 billion, up 6.4%. Net income was close to $4 billion, which resulted in a net margin of 62%. This high level of profitability demonstrates the scaling power of a global exchange platform as volumes increase.
As of CME's December 2025 balance sheet, the debt-to-equity ratio is roughly 0.1. This ratio compares total debt to shareholder equity, indicating the company uses very little borrowed money. The current ratio is approximately 1.0, meaning it has enough short-term assets to cover its immediate obligations.
Free cash flow, which is cash from operations minus capital expenditures, was approximately $4.2 billion. Because stock-based compensation accounted for only 2.2% of operating cash flow, CME does not rely heavily on non-cash compensation. This strong cash generation supports its ability to pay dividends and reinvest in market technology.
The case for Coinbase Global
Coinbase Global provides a comprehensive platform for individuals and institutions to trade Bitcoin (CRYPTO:BTC) and other digital assets. The company generates revenue through transaction fees, subscription services, and its partnership with Circle (NYSE:CRCL) for stablecoin management. It also serves roughly 245,000 ecosystem partners across more than 100 countries.
The company is expanding beyond simple trading by developing infrastructure like the Base blockchain network. These services aim to make the company a foundational layer for the decentralized economy. By offering custody and prime brokerage, it attracts large institutional clients who require high security for their digital holdings.
In Coinbase's latest annual report, filed for fiscal 2025, revenue reached nearly $7.2 billion, a 9.4% increase from the previous year. Net income was roughly $1.3 billion, yielding a net margin of nearly 17.6%. While revenue grew, this net margin was lower than in 2024 as the company invested in new business lines.
As of its December 2025 balance sheet, the current ratio is approximately 2.3. This figure measures the ability to cover short-term debt with current assets; a value over 1 indicates a healthy cushion. The company maintains a debt-to-equity ratio of about 0.5, showing a moderate level of leverage.
Free cash flow for the year reached nearly $2.4 billion, providing significant capital for expansion. Note that stock-based compensation accounted for roughly 34.6% of operating cash flow, inflating reported cash generation, since SBC is a non-cash expense added back in the cash flow statement. This high level of stock-based pay is common among growing tech-heavy companies.
Risk profile comparison
CME Group faces intense competition from other major exchange operators including Intercontinental Exchange (NYSE:ICE) and Cboe Global Markets (NYSEMKT:CBOE). The company must also navigate complex global regulations that could change capital requirements or transaction taxes. Operational risks include reliance on third-party data providers and the constant threat of cybersecurity breaches.
Coinbase Global operates in a highly uncertain regulatory environment where authorities may classify certain assets as securities. Revenue is heavily concentrated in Bitcoin and Ethereum (CRYPTO:ETH), making the business sensitive to price swings in those assets. The company also competes with decentralized trading platforms and traditional financial giants entering the crypto space.
Valuation comparison
CME Group trades at a lower multiple of future earnings estimates, while Coinbase Global trades at a lower price relative to its sales over the past 12 months.
| Metric | CME | Coinbase Global |
|---|---|---|
| Forward P/E | 23.5 | 61.3 |
| P/S ratio | 15.3 | 7.4 |
Valuation metrics include sourcing from Financial Modeling Prep (FMP) and may differ from other data providers.
Which stock would I buy in 2026?
Coinbase Global doesn't appeal to me because crypto doesn't appeal to me. Investing in crypto only makes sense if you ascribe to the "greater fool" theory, because crypto doesn't produce earnings or cash flow, and it has no real-world utility (you can't buy anything with crypto because it's so volatile). Buying crypto is entirely a bet that someone will later buy it from you at a higher price; it has no inherent value.
And Coinbase's fortunes are inextricably linked to crypto, as seen in this chart:
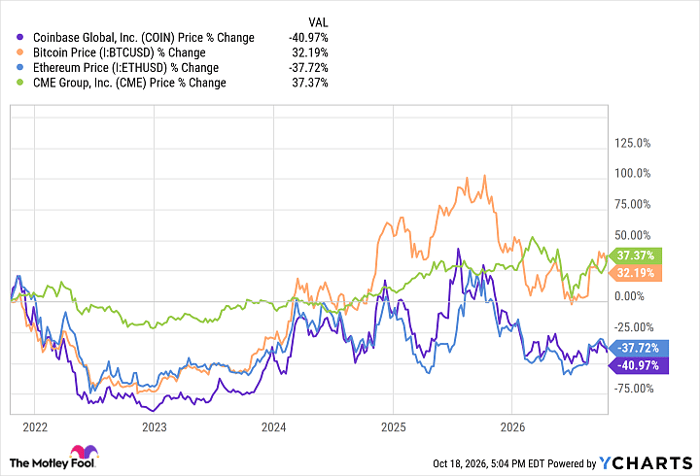
COIN data by YCharts
I don't think crypto is a legitimate investment asset, and I don't think you can forever count on greater fools jumping in to buy your tokens. So Coinbase's crypto ties make it an unattractive investment to me.
Furthermore, CME's net margin dwarfs Coinbase's. CME also has a much more reasonable forward P/E ratio and pays a modest dividend. I'd much sooner buy shares of CME.
Should you buy stock in CME Group right now?
Before you buy stock in CME Group, consider this:
The Motley Fool Stock Advisor analyst team just identified what they believe are the 10 best stocks for investors to buy now… and CME Group wasn’t one of them. The 10 stocks that made the cut could produce monster returns in the coming years.
Consider when Netflix made this list on December 17, 2004... if you invested $1,000 at the time of our recommendation, you’d have $380,363!* Or when Nvidia made this list on April 15, 2005... if you invested $1,000 at the time of our recommendation, you’d have $1,315,732!*
Now, it’s worth noting Stock Advisor’s total average return is 919% — a market-crushing outperformance compared to 211% for the S&P 500. Don't miss the latest top 10 list, available with Stock Advisor, and join an investing community built by individual investors for individual investors.
See the 10 stocks »
*Stock Advisor returns as of October 19, 2026.
Erin Kennedy has positions in CME Group. The Motley Fool has positions in and recommends Alphabet, Bitcoin, CME Group, Ethereum, and S&P Global. The Motley Fool recommends Cboe Global Markets, Coinbase Global, Flutter Entertainment, Intercontinental Exchange, and Nasdaq. The Motley Fool has a disclosure policy.
Recommended Articles


