


Bitcoin Price Prediction: BTC Reclaims $81,000, Can It Keep Rising After Digesting Fed Headwinds?
TradingKey - On Sunday (September 20), Bitcoin (BTC) consolidated at high levels following Thursday's rebound, currently trading around $81,100. Previously hit by the failure to advance the U.S. crypto bill and the Federal Reserve's rate hike, Bitcoin once fell to around $75,500, but subsequently reclaimed the $76,000, $78,000, and $80,000 marks in succession, improving market sentiment.
As Fed Rate Hikes and Bill Headwinds Are Gradually Digested, Renewed ETF Inflows Push Bitcoin Back to $80,000
The main reason behind Bitcoin's rapid rebound from around $75,000 to above $81,000 in this cycle is that after two major headwinds—the stall of the U.S. crypto bill and the Federal Reserve's rate hike—materialized in succession, expectations of further deterioration failed to emerge, prompting the market to begin unwinding its previously over-concentrated pessimistic pricing.
First was U.S. crypto regulatory policy. On September 15, the U.S. Senate failed to advance the CLARITY Act, with the bill receiving only 50 votes in favor, falling short of the 60-vote threshold required for procedural approval. The bill was originally intended to further clarify the regulatory authorities of the SEC and CFTC over digital assets; thus, following the failed vote, Bitcoin and crypto-related stocks dropped noticeably for a time. However, this outcome did not mean that the U.S. crypto regulatory process had come to a complete halt. The SEC and CFTC subsequently continued to push forward rulemaking related to digital assets, and the worst-case regulatory scenario did not escalate further, which helped the market gradually digest the shock of the bill's failure.
The second turning point came from the Federal Reserve. The Fed raised interest rates by 25 basis points at its September meeting and signaled that there was still room for further rate hikes in the future. Immediately following the decision, the U.S. dollar and Treasury yields rose, sending Bitcoin temporarily down to near $75,000. However, as the market finished repricing the rate hike, oil prices and certain Treasury yields subsequently pulled back, while the U.S. dollar also cooled slightly from its post-decision highs. Although Federal Reserve policy remained relatively tight, the market avoided a fresh round of significant tightening shocks, and selling pressure on risk assets began to ease.
After macro pressures eased, renewed inflows into spot Bitcoin ETFs became a more direct capital catalyst for this rebound. Data from Farside Investors shows that U.S. spot Bitcoin ETFs recorded net outflows of approximately $450 million and $296 million on September 15 and 16, respectively. However, flows reversed to a net inflow of $160 million on September 17 and logged a further net inflow of about $325 million on September 18, with Fidelity's FBTC drawing approximately $311 million in a single day. The rapid shift from consecutive outflows to inflows indicates that institutional buying re-emerged after Bitcoin dropped into the $75,000–$77,000 range.
However, macro pressures have not entirely dissipated. The Fed still signals the possibility of another rate hike this year, and elevated U.S. Treasury yields mean that Bitcoin must continue to contend with a high risk-free rate environment. In addition, the CLARITY Act has yet to achieve a new legislative breakthrough, leaving regulatory uncertainty intact.
Bitcoin Price Technical Analysis
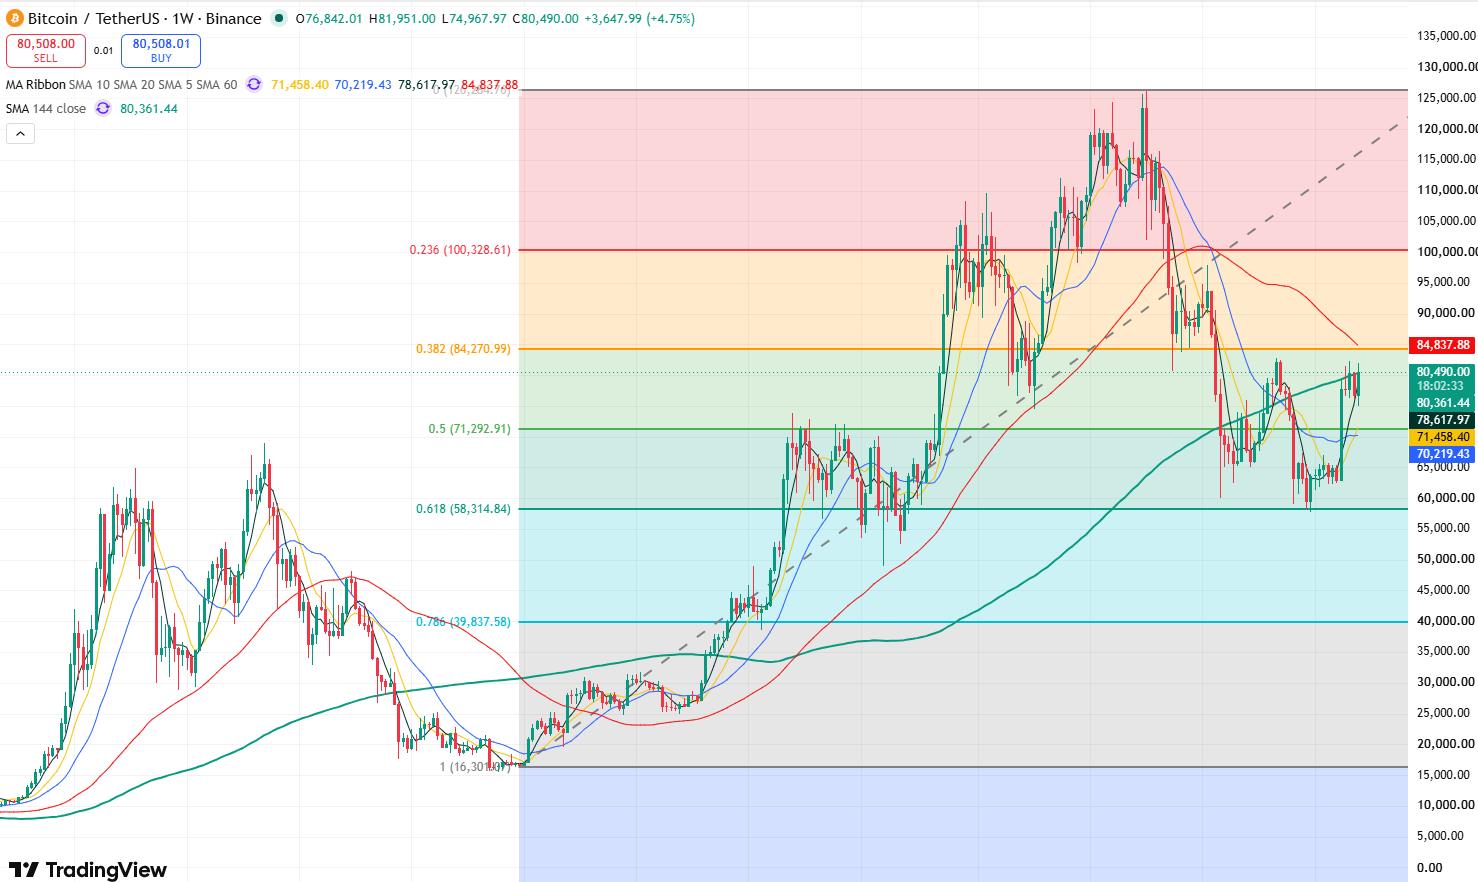
Bitcoin price weekly chart, Source: TradingView
From Bitcoin's weekly chart, Bitcoin rebounded rapidly from $75,500 to above $81,000 this week, but it remains under pressure below this month's high of $82,300, indicating that recent price action continues to consolidate at elevated levels.
Currently, Bitcoin faces a key resistance zone of $83,000-$84,000 on the upside. Meanwhile, $84,000 sits below the 60-period simple moving average (SMA60), where confluent resistance may form. If Bitcoin can convincingly break out and hold above $84,000, it will open up upside potential toward $98,000-$100,000.
Conversely, if Bitcoin remains under pressure below $84,000 and shows signals of sustained weakness, it may continue to trade within the $75,000-$83,000 range in the short term. If it falls below $75,000, Bitcoin may enter a deeper correction phase, potentially sliding toward the $70,000 mark.
Recommended Articles


