


Bitcoin Price Forecast: BTC extends cautious rebound as ETF outflows, hawkish Fed risks cap upside potential
- Bitcoin extends rebound trading above $76,500 on Thursday after a mild recovery the previous day.
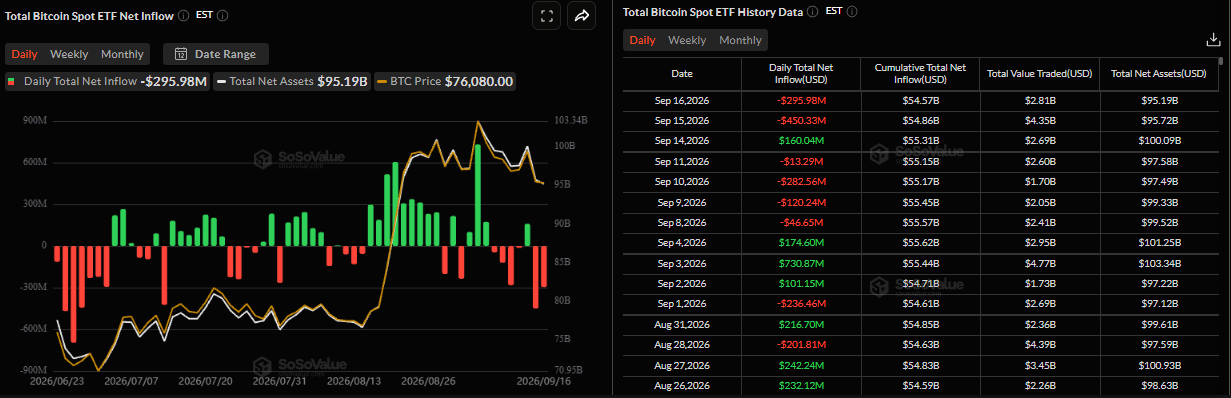
- US-listed spot ETFs recorded an outflow of $295.98 million on Wednesday, marking the second consecutive day of withdrawals this week.
- The Fed’s hawkish outlook, alongside escalating Middle East tensions, could limit BTC upside potential.
Bitcoin (BTC) extends cautious rebound trading around $76,500 at the time of writing on Thursday after a mild recovery in the previous session. Continued outflows from spot Bitcoin Exchange-Traded Funds (ETFs) highlight cautious institutional positioning so far this week. Meanwhile, the Crypto King’s upside remains limited as a hawkish Federal Reserve (Fed) outlook and escalating tensions in the Middle East weigh on risk appetite.
Institutional demand shows weakening signs
Institutional demand shows a cautious stance among investors so far this week. SoSoValue data shows that spot ETFs recorded an outflow of $295.98 million on Wednesday after an outflow of $450.33 million on Tuesday. It marks the second consecutive day of withdrawals this week, highlighting weakening signs. If these outflows continue and intensify throughout the week, BTC could see a deeper correction.
Fed rate hike and hawkish outlook cap BTC
The US central bank voted unanimously to raise its benchmark interest rate by 25 basis points (bps), bringing the Federal Funds Target range to 3.75%-4.00% for the first time since 2023 at the conclusion of the September policy meeting on Wednesday.
The decision aligned with broader market consensus and came with a more hawkish outlook. In fact, the so-called dot plot revealed that Fed officials expect one more interest rate increase within this year.
At the post-meeting press conference, Fed Chair Kevin Warsh said that a strengthening US economy, a lack of improvement in summer inflation trends, and geopolitics led to the decision.
Warsh added that inflation is too high and has been for too long, while underscoring the importance of stabilizing consumer prices to grow the US economy.
Furthermore, inflation risks from persistently high energy prices underpin prospects for further Fed tightening and support elevated US bond yields. In fact, the yield on the benchmark 10-year US Treasury remains close to the 5.0% psychological mark and its highest level since mid-2007.
On the geopolitical front, Iran-backed Houthi rebels said that Saudi aircraft have carried out more than 450 air strikes across Yemen in the past week and claimed that they shot down a Saudi F-15 fighter jet over Marib province.
Meanwhile, US President Donald Trump claimed that Iran wants to make a deal and that the war may be nearing its end. Nevertheless, intensifying fighting between the Houthi group and Saudi Arabia keeps the geopolitical risk premium in play, supporting Oil prices.
Hawkish Fed outlook and escalating Middle East tensions come as the US crypto regulatory framework faces further uncertainty after the CLARITY Act failed to advance in the Senate on Tuesday. Together, these developments have supported demand for the safe-haven US Dollar (USD), potentially limiting BTC upside potential.
Bitcoin technical outlook: Holds key EMAs
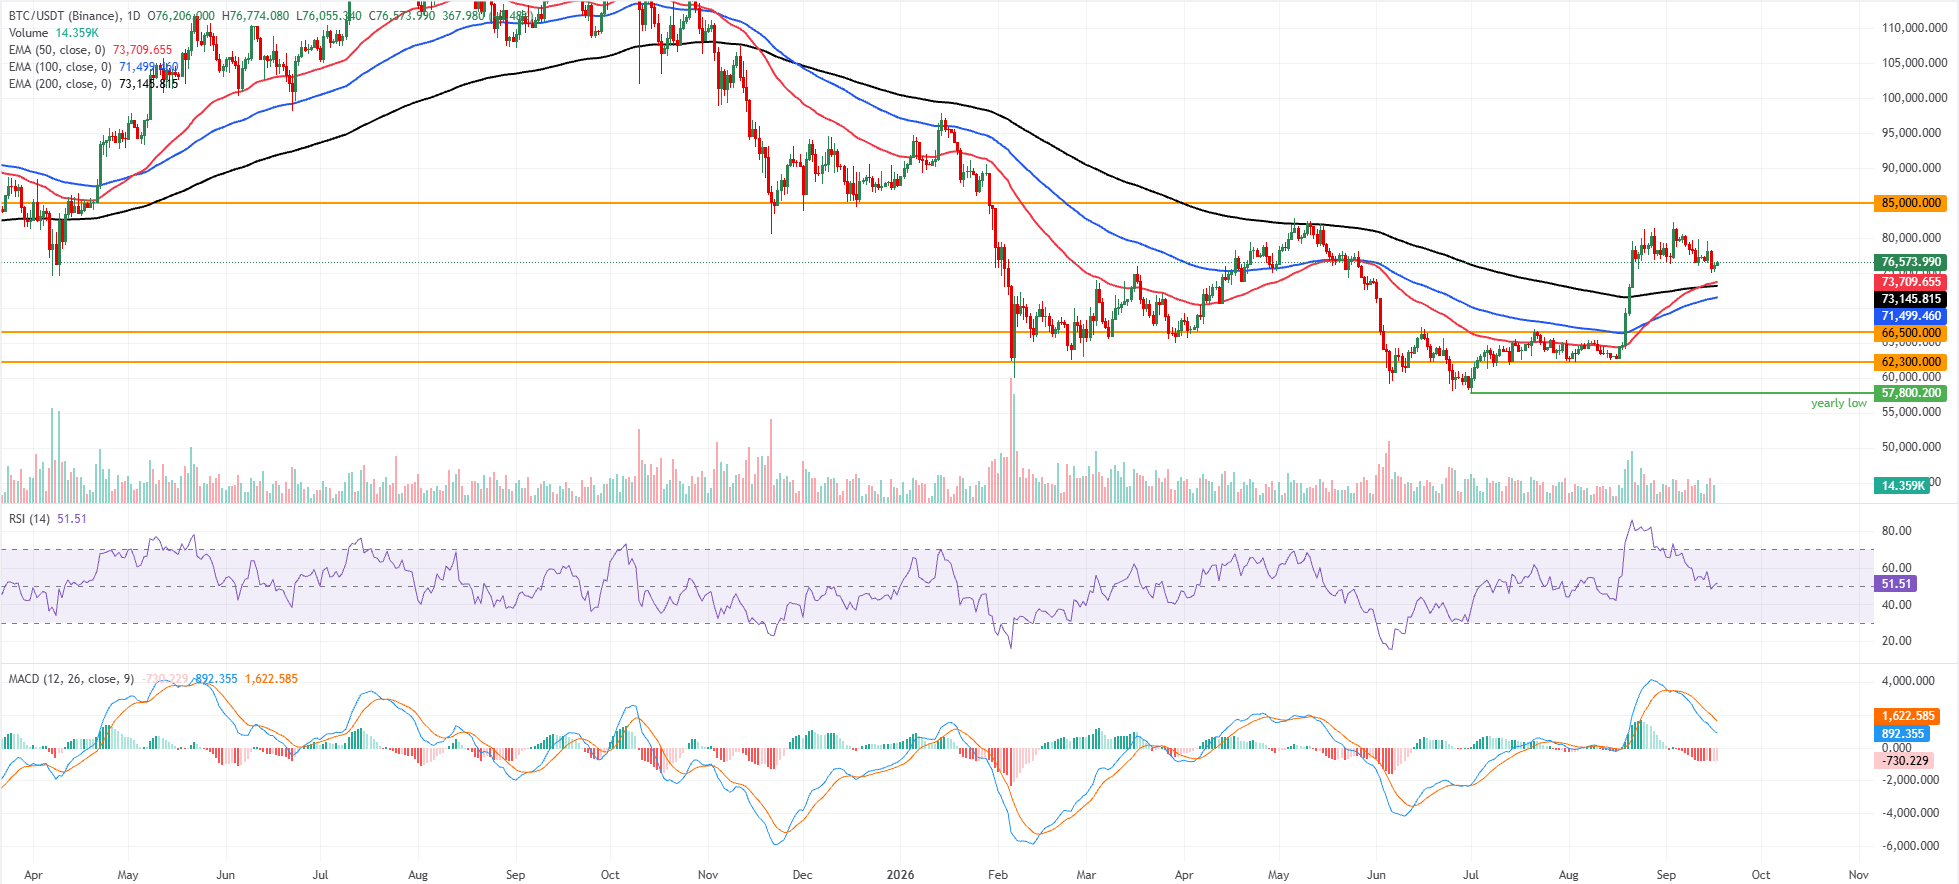
Bitcoin price trades at $76,573 on Thursday after a mild recovery the previous day. BTC holds a bullish near-term bias as it remains above the 50-day, 100-day, and 200-day Exponential Moving Averages (EMAs), clustered between roughly $71,500 and $73,700, reinforcing a supported structure on pullbacks.
The Relative Strength Index (RSI) at 51 has retreated from prior overbought readings and now sits near neutral territory. Meanwhile, the Moving Average Convergence Divergence (MACD) remains negative, with the line below zero and the histogram still contracting, suggesting bullish momentum is moderating but not yet reversing the broader uptrend.
On the downside, immediate support is found near the 50-day EMA at $73,709, followed by the 200-day EMA at $73,145 and the 100-day EMA at $71,499, with deeper cushions at the horizontal levels of $66,500 and $62,300 should a larger correction unfold.
On the topside, the next key resistance aligns with the horizontal barrier at $85,000, where a daily close above would likely reopen the path toward fresh highs. At the same time, failure to clear this cap would keep BTC consolidating over its rising EMA stack.
(The technical analysis of this story was written with the help of an AI tool. Know more.)
Bitcoin, altcoins, stablecoins FAQs
Bitcoin is the largest cryptocurrency by market capitalization, a virtual currency designed to serve as money. This form of payment cannot be controlled by any one person, group, or entity, which eliminates the need for third-party participation during financial transactions.
Altcoins are any cryptocurrency apart from Bitcoin, but some also regard Ethereum as a non-altcoin because it is from these two cryptocurrencies that forking happens. If this is true, then Litecoin is the first altcoin, forked from the Bitcoin protocol and, therefore, an “improved” version of it.
Stablecoins are cryptocurrencies designed to have a stable price, with their value backed by a reserve of the asset it represents. To achieve this, the value of any one stablecoin is pegged to a commodity or financial instrument, such as the US Dollar (USD), with its supply regulated by an algorithm or demand. The main goal of stablecoins is to provide an on/off-ramp for investors willing to trade and invest in cryptocurrencies. Stablecoins also allow investors to store value since cryptocurrencies, in general, are subject to volatility.
Bitcoin dominance is the ratio of Bitcoin's market capitalization to the total market capitalization of all cryptocurrencies combined. It provides a clear picture of Bitcoin’s interest among investors. A high BTC dominance typically happens before and during a bull run, in which investors resort to investing in relatively stable and high market capitalization cryptocurrency like Bitcoin. A drop in BTC dominance usually means that investors are moving their capital and/or profits to altcoins in a quest for higher returns, which usually triggers an explosion of altcoin rallies.
Recommended Articles


