

Pi Network Price Forecast: PI extends losses below $1 billion market capitalization

Source Fxstreet
  • Pi Network hovers around $0.083 on Thursday after facing 7% losses two days in a row.
  • Broader market uncertainty linked to the US Fed rate hike and the failure of the CLARITY Act to advance weighs on Pi Network.
  • The technical outlook for PI is bearish, with the $0.0819 support level in focus.

Pi Network (PI) faces intense downside pressure, edging lower on Thursday after two consecutive days of 7% losses. The broader market uncertainty weighs on the Pi Core Team’s efforts to boost ecosystem expansion through network upgrades. The technical outlook for PI is bearish, with bears watching for a break below the $0.0819 support level. 

Pi Network market capitalization drops below $1 billion amid rate hike, CLARITY Act delay

The CLARITY Act failed to advance to the US Senate floor for cloture voting on Tuesday, followed by the US Federal Reserve (Fed) raising interest rates by 25 bps on Wednesday, posing regulatory and macroeconomic challenges for crypto investors. These challenges overshadow the recent SoloHost Apps launched by the Pi Core Team to boost development and ecosystem activity.

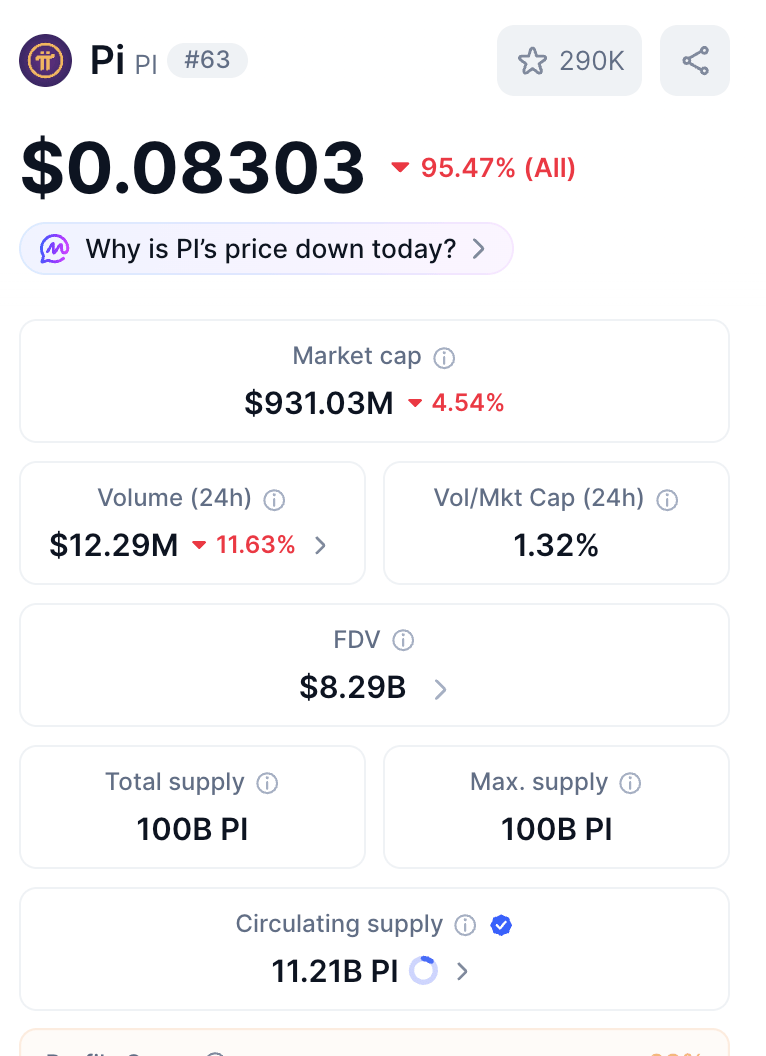
The broader cryptocurrency market maintains a risk-on sentiment, with the Fear and Greed Index holding flat at 63, above the neutral zone, on Thursday. However, high-risk, low-valuation altcoins such as Pi Network have seen heavy selling over the last two days, with declines exceeding 14%. CoinMarketCap data shows the PI token market cap dropped below $1 billion on Wednesday, reflecting reduced investor confidence.
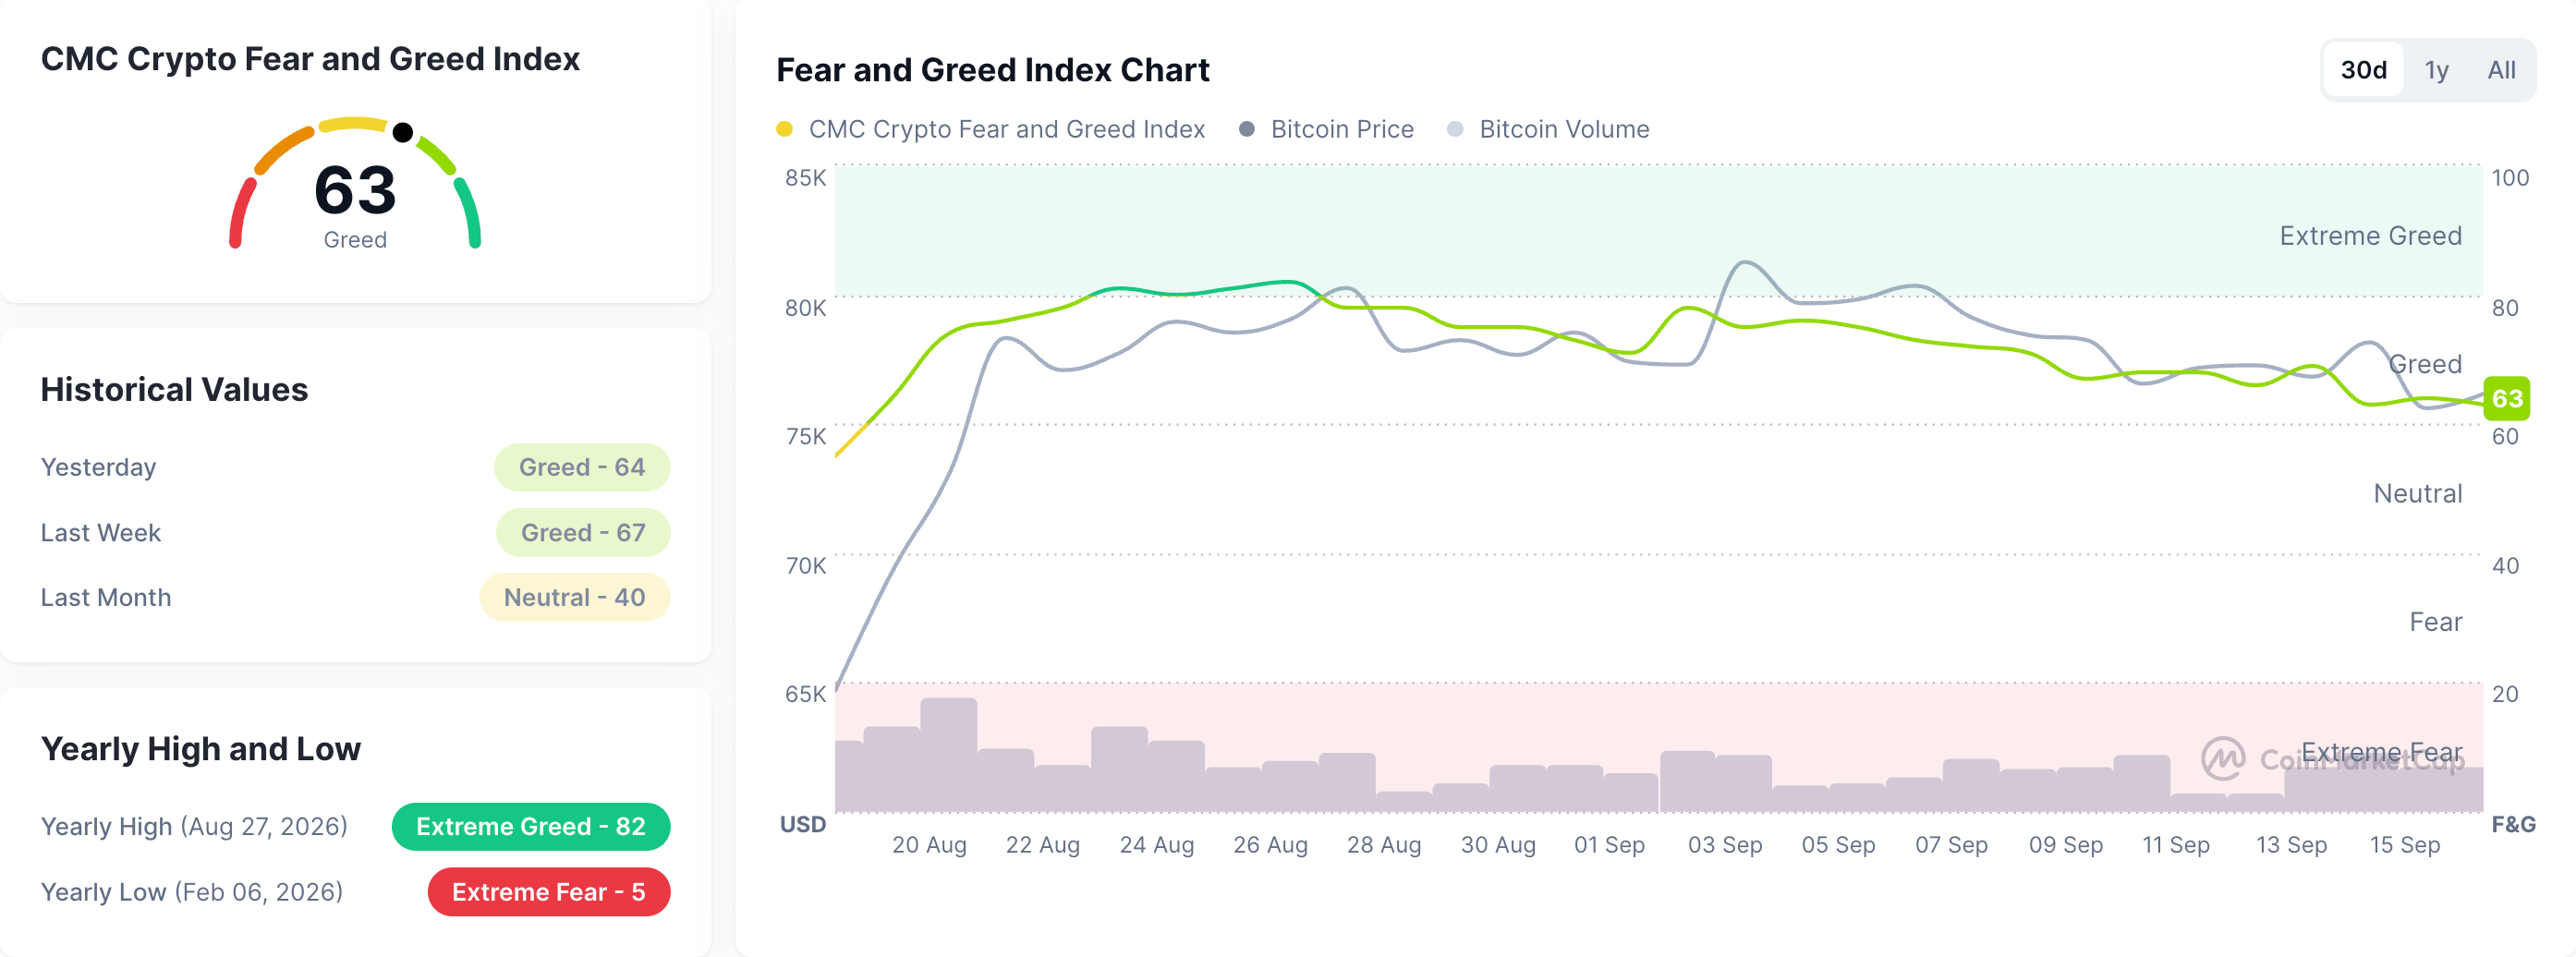
Fear and Greed Index. Source: CoinMarketCap
Pi Network metrics. Source: CoinMarketCap

Technical outlook: Pi Network gains bearish momentum

Pi Network trades in the red for the third consecutive day on Thursday, extending its near-term bearish bias. PI token breached below its 50-day Exponential Moving Average (EMA) around $0.0936 on Wednesday, reinforcing the downside structure with the overhead 100- and 200-day EMAs at $0.1037 and $0.1284.

Momentum reinforces this weak tone, with the Relative Strength Index (RSI) slipping toward the oversold area near 34, while the Moving Average Convergence Divergence (MACD) has crossed below zero and its signal line, with a negative and expanding histogram hinting at persistent selling pressure.

Looking down, the immediate support aligns with the 23.6% Fibonacci retracement level at $0.0819, measured from $0.1341 to $0.0704. A confirmed breakout below this level could target the $0.0704 swing low, threatening a potential new all-time low if selling pressure sustains.

PI/USDT daily price chart.

On the upside, the 50-day EMA at $0.0936 serves as the immediate bullish target in case of a rebound. Beyond that, the 50% retracement level at $0.0971 and the 100-day EMA at $0.1036 could act as the next resistance levels.

(The technical analysis of this story was written with the help of an AI tool. Know more.)

Disclaimer: For information purposes only. Past performance is not indicative of future results.
placeholder
XRP Price Prediction for July 2026: Can Buyers Finally Break the Downtrend?XRP (XRP) price trades near $1.05, caught between a year-long downtrend and a sudden burst of buying.July has historically rewarded XRP holders. This year the month arrives with on-chain accumulation
Author  Beincrypto
Jun 30, Tue
XRP (XRP) price trades near $1.05, caught between a year-long downtrend and a sudden burst of buying.July has historically rewarded XRP holders. This year the month arrives with on-chain accumulation
placeholder
Gold Price Forecast: Iran Denies Trump Negotiation Plan, Gold Price May Fall to $3,500TradingKey - As of today's (July 1st) Asian morning session, gold ( XAUUSD) prices maintained a weak intraday decline. After stabilizing above $4,000 at yesterday's close, the gold price broke below $
Author  TradingKey
Jul 01, Wed
TradingKey - As of today's (July 1st) Asian morning session, gold ( XAUUSD) prices maintained a weak intraday decline. After stabilizing above $4,000 at yesterday's close, the gold price broke below $
placeholder
XAUUSD Gold Analysis: Gold Holds Above $4,350 Ahead of US Inflation Data Is $4,500 Next? Gold holds above $4,350 following weak US jobs data. As inflation reports approach and UBS eyes $5,000, can XAUUSD break resistance at $4,435 to rally toward $4,500?
Author  Naoufal Seddik
Aug 12, Wed
Gold holds above $4,350 following weak US jobs data. As inflation reports approach and UBS eyes $5,000, can XAUUSD break resistance at $4,435 to rally toward $4,500?
placeholder
Gold Price Analysis Today: Gold Drops 1.32% Despite Lower Fed Rate-Hike Bets, Can $4,313 Support Hold? Gold fell 1.32% on August 13 after rising to $4,449.73, then reversing lower and closing near $4,349.918 below the $4,356.46 support. Softer US inflation data reduced Fed rate hike expectations, but selling pressure still dominated the session. Will $4,313 support hold?
Author  Naoufal Seddik
Aug 14, Fri
Gold fell 1.32% on August 13 after rising to $4,449.73, then reversing lower and closing near $4,349.918 below the $4,356.46 support. Softer US inflation data reduced Fed rate hike expectations, but selling pressure still dominated the session. Will $4,313 support hold?
placeholder
Gold Price Analysis Today: Gold Gains 0.94% as Markets Expect Fed to Hold Rates, Can $4,449 Resistance Break? Gold gained 0.94% on August 17, closing near $4,417.30 as softer US data strengthened expectations for unchanged Fed rates in September. Gold remains bullish, with $4,449.730 resistance and $4,310.650 support in focus.
Author  Naoufal Seddik
Aug 18, Tue
Gold gained 0.94% on August 17, closing near $4,417.30 as softer US data strengthened expectations for unchanged Fed rates in September. Gold remains bullish, with $4,449.730 resistance and $4,310.650 support in focus.
goTop
quote