

Solana Price Forecast: Strong institutional confidence keeps SOL afloat above $100

Source Fxstreet
  • Solana hovers above $100 on Monday, testing the psychological support after a 3% drop the previous day.
  • SOL-focused ETFs recorded over $150 million in inflows last week, the second-highest since the inception week.
  • The technical outlook for Solana is mixed as the price tests key psychological support amid waning bullish momentum.

Solana (SOL) price is trading around $100 on Monday, testing the psychological support level after a 3% decline the previous day. SOL-focused Exchange Traded Funds (ETFs) recorded over $150 million in inflows last week, reflecting strong institutional demand. Solana risks capitulation as price tests the $100 threshold amid easing bullish momentum.

ETF inflows, double disinflation projects long-term growth

Solana is gaining institutional strength amid major governance updates. SOL-focused ETFs recorded $153.87 million in inflows last week, with nine consecutive days of inflows. Typically, strong ETF inflows project long-term growth, fueling demand from large-wallet and retail investors amid growing risk appetite.
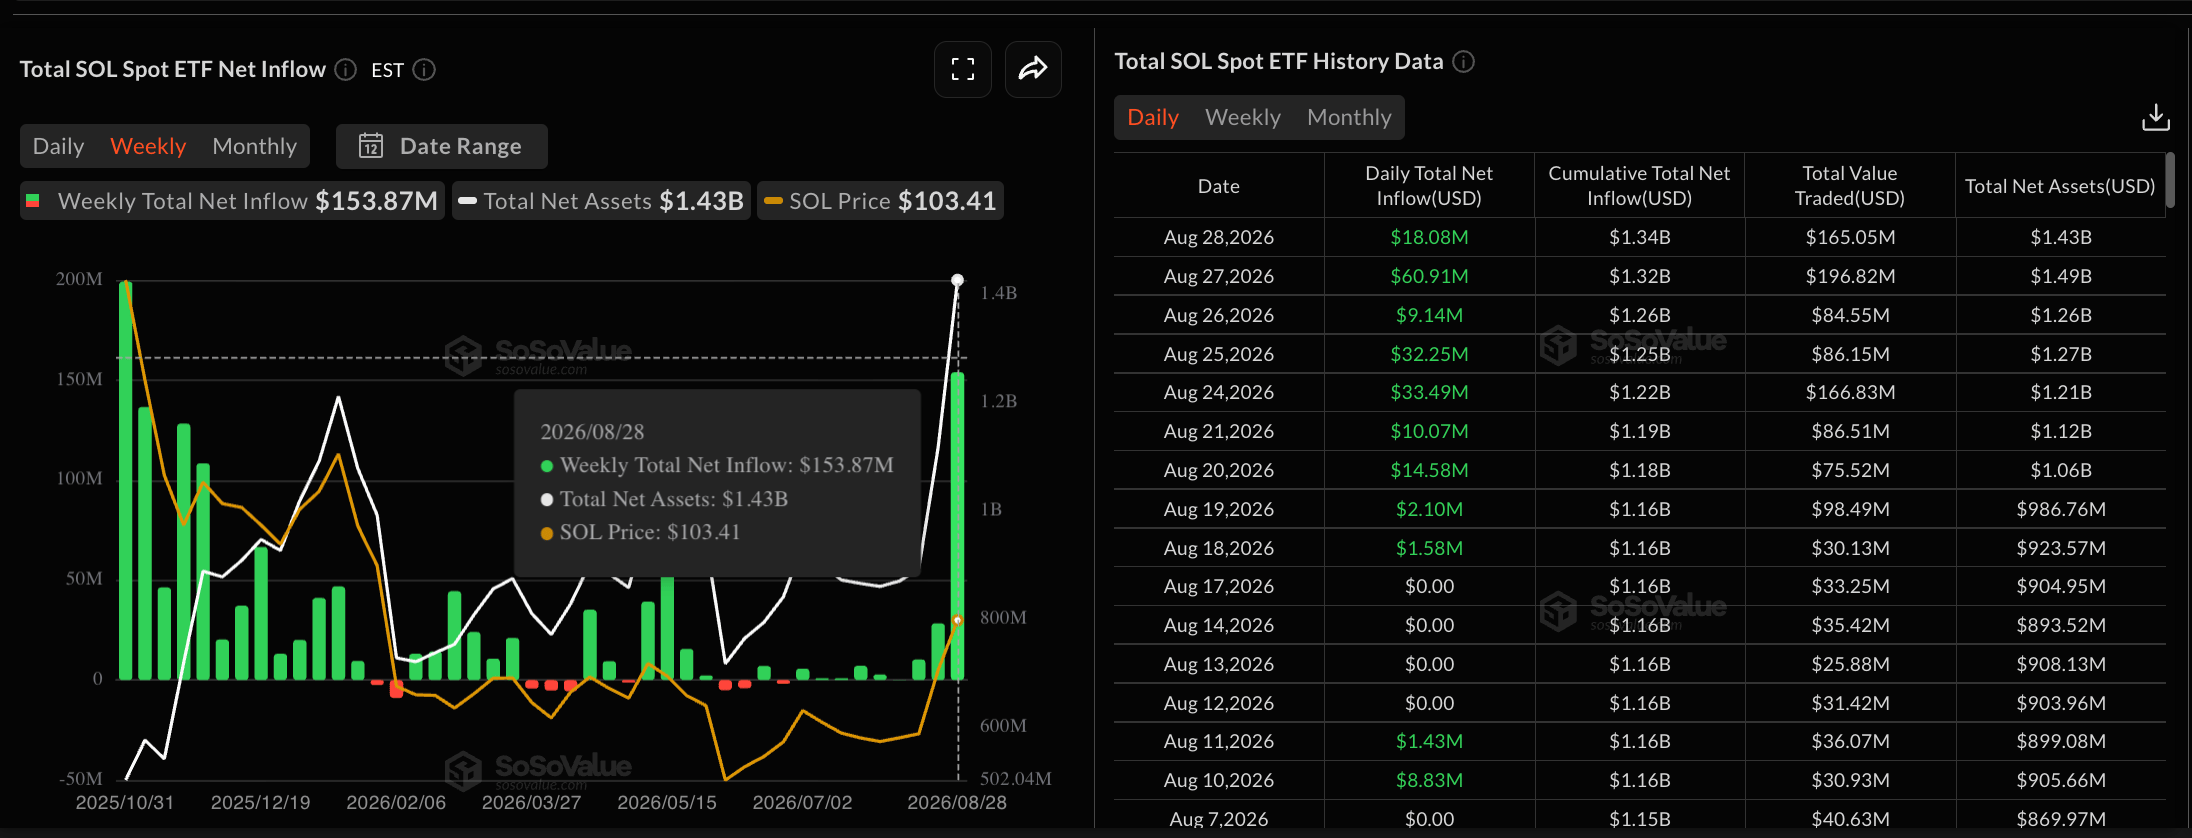
SOL ETFs data. Source: Sosovalue

On the network side, Solana validators voted to double the disinflation rate to 30% and establish a new governance framework. However, the proposal to introduce usage-based fees, which could have raised daily SOL burns to almost 9,000 tokens, failed. Overall, the governance votes favored better structuring and disinflation to promote long-term growth. 
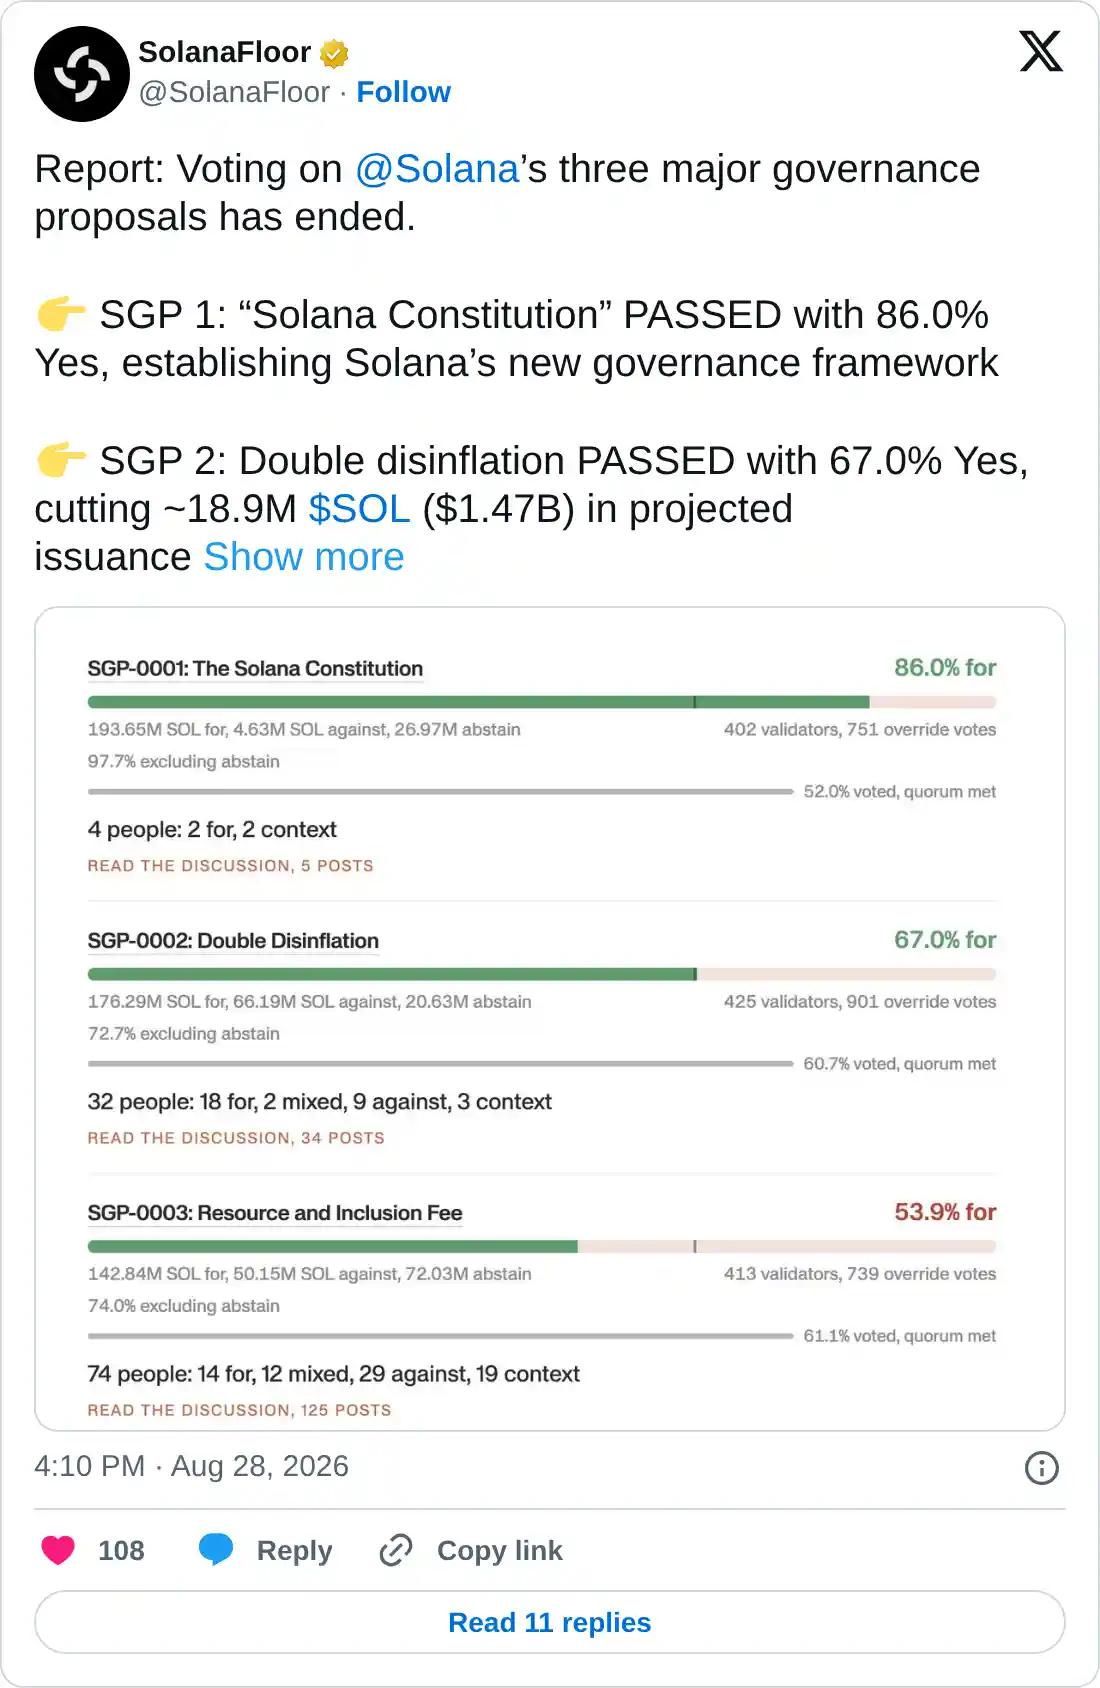
https://x.com/SolanaFloor/status/2093370745854529747

Technical outlook: Will SOL price sustain above $100?

Solana trades around $101.59 at press time on Monday, maintaining a constructive bullish bias. SOL holds above the 50-day Exponential Moving Average (EMA) at $85.05, the 100-day EMA at $82.77, and the 200-day EMA at $89.71, all of which sit below the market, hinting at a well-supported uptrend structure.

Momentum remains firm, with the Relative Strength Index (RSI) down to 67 on the daily chart from overbought conditions, showing easing buying pressure. At the same time, the Moving Average Convergence Divergence (MACD) edges lower toward the signal line, reaffirming reduced buying pressure.

On the topside, the next notable hurdle is the December 18 low at $116.88, which represents a significant structural barrier to any extended rally.

Chart Analysis SOL/USDT (Binance)
SOL/USDT daily price chart.

On the downside, immediate technical support is at the February 1 low of $98.02, followed by the 200-day EMA at $89.71 and the 50-day EMA at $85.05.

(The technical analysis of this story was written with the help of an AI tool. Know more.)

Disclaimer: For information purposes only. Past performance is not indicative of future results.
placeholder
WTI Crude Slips Below $90 as Easing Mideast Tensions and Supply Dynamics Flash Bearish Signals WTI crude breached the critical $90 threshold as fading Middle East risks and technical breakdowns signaled a bearish pivot, leaving oil vulnerable to further downside toward $85.
Author  Mitrade Team
Jun 09, Tue
WTI crude breached the critical $90 threshold as fading Middle East risks and technical breakdowns signaled a bearish pivot, leaving oil vulnerable to further downside toward $85.
placeholder
XRP Price Prediction for July 2026: Can Buyers Finally Break the Downtrend?XRP (XRP) price trades near $1.05, caught between a year-long downtrend and a sudden burst of buying.July has historically rewarded XRP holders. This year the month arrives with on-chain accumulation
Author  Beincrypto
Jun 30, Tue
XRP (XRP) price trades near $1.05, caught between a year-long downtrend and a sudden burst of buying.July has historically rewarded XRP holders. This year the month arrives with on-chain accumulation
placeholder
Gold Price Analysis Today: Gold Drops 1.32% Despite Lower Fed Rate-Hike Bets, Can $4,313 Support Hold? Gold fell 1.32% on August 13 after rising to $4,449.73, then reversing lower and closing near $4,349.918 below the $4,356.46 support. Softer US inflation data reduced Fed rate hike expectations, but selling pressure still dominated the session. Will $4,313 support hold?
Author  Naoufal Seddik
Aug 14, Fri
Gold fell 1.32% on August 13 after rising to $4,449.73, then reversing lower and closing near $4,349.918 below the $4,356.46 support. Softer US inflation data reduced Fed rate hike expectations, but selling pressure still dominated the session. Will $4,313 support hold?
placeholder
Gold Price Analysis Today: Gold Gains 0.94% as Markets Expect Fed to Hold Rates, Can $4,449 Resistance Break? Gold gained 0.94% on August 17, closing near $4,417.30 as softer US data strengthened expectations for unchanged Fed rates in September. Gold remains bullish, with $4,449.730 resistance and $4,310.650 support in focus.
Author  Naoufal Seddik
Aug 18, Tue
Gold gained 0.94% on August 17, closing near $4,417.30 as softer US data strengthened expectations for unchanged Fed rates in September. Gold remains bullish, with $4,449.730 resistance and $4,310.650 support in focus.
placeholder
Gold Price Analysis Today: Gold Rebounds After 1.91% Drop as Yields Ease. Is $4,449 Next? Gold fell about 1.91% on August 18 before producing a strong bullish reaction from the 1-hour demand zone in early August 19 trading. RSI is recovering from oversold conditions, but Supertrend remains bearish as traders await the Fed minutes.
Author  Naoufal Seddik
Aug 19, Wed
Gold fell about 1.91% on August 18 before producing a strong bullish reaction from the 1-hour demand zone in early August 19 trading. RSI is recovering from oversold conditions, but Supertrend remains bearish as traders await the Fed minutes.
Related Instrument
goTop
quote