

Nvidia Stock Price Prediction: Nvidia Dives Over 4% From Highs, Can It Hit New Highs Again?

Source Tradingkey

TradingKey - On August 31, Eastern Time, AI giant Nvidia (NVDA) shares extended their pullback, dropping 0.12% in overnight trading to $217.19. Last Friday (August 28), Nvidia shares continued to fall, plunging 4.57% to close at $217.55. This large bearish candlestick dealt a heavy blow to market expectations for a bullish push to new highs.

Why Is Nvidia Stock Falling?

Nvidia's stock price experienced a downward correction last Friday, driven primarily by profit-taking in tech stocks triggered by macroeconomic headwinds, rather than operational issues at Nvidia itself. Federal Reserve (Fed) Chair Warsh delivered a hawkish speech at the Jackson Hole annual central banking symposium, warning that sticky services inflation and a still-tight labor market leave limited room for central bank rate cuts.

The hawkish signals released by Warsh rapidly cooled rate-cut expectations, directly hammering rate-sensitive megacap tech and semiconductor stocks. The S&P 500, Nasdaq 100, and Philadelphia Semiconductor Index (SOX) all plunged across the board that day, while prompting some capital in Nvidia to lock in profits. Nvidia's earnings report released after the bell on August 26 significantly exceeded expectations, driving an explosive surge of nearly 9% in its stock price the next day to close at $227.98, just shy of its all-time high of $236, which resulted in a heavy concentration of profit-taking positions in its trading structure.

Can Nvidia Stock Continue to Rise to New Highs?

Nvidia possesses long-term fundamental momentum to reach new record highs, as reflected in its CUDA software ecosystem, NVLink networking technology, and strong profitability with gross margins remaining above 70%. However, in the short to medium term, it faces pressure from high valuation adjustments and macroeconomic interest rate volatility. As its revenue base expands, year-over-year revenue growth is gradually slowing, and the market has extremely high expectations for the magnitude of earnings beats, where failing to meet them even slightly can easily trigger profit-taking selling pressure. In addition, CoWoS advanced packaging capacity and high-bandwidth memory (HBM) supply conditions continue to constrain shipment speeds.

From a technical analysis standpoint, Nvidia's stock price dropped sharply after approaching its historical high, engulfing part of the gains driven by positive earnings. This reflects that bearish forces hold the upper hand at this level, placing it under further downside pressure. If it further breaks below the key support level of $200, caution is required regarding the risk of a pullback to around the lower band at $190.
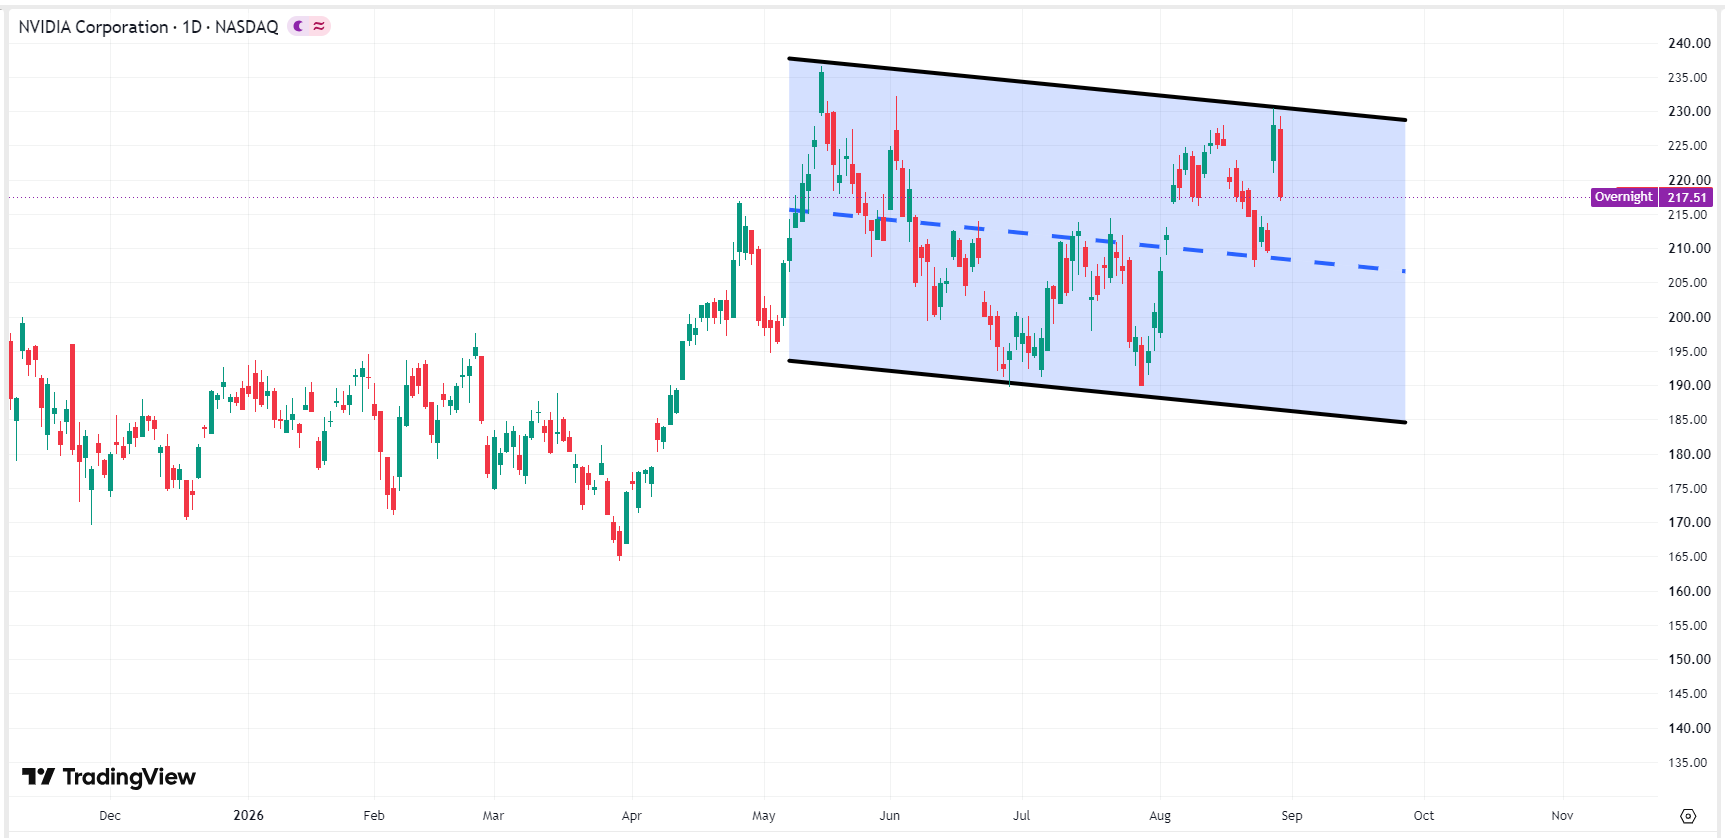
nvidia-nvda-price-060693bd09444b97a05b8917993f7d2cNvidia stock price chart, Source: TradingView

Disclaimer: For information purposes only. Past performance is not indicative of future results.
placeholder
WTI Crude Slips Below $90 as Easing Mideast Tensions and Supply Dynamics Flash Bearish Signals WTI crude breached the critical $90 threshold as fading Middle East risks and technical breakdowns signaled a bearish pivot, leaving oil vulnerable to further downside toward $85.
Author  Mitrade Team
Jun 09, Tue
WTI crude breached the critical $90 threshold as fading Middle East risks and technical breakdowns signaled a bearish pivot, leaving oil vulnerable to further downside toward $85.
placeholder
XRP Price Prediction for July 2026: Can Buyers Finally Break the Downtrend?XRP (XRP) price trades near $1.05, caught between a year-long downtrend and a sudden burst of buying.July has historically rewarded XRP holders. This year the month arrives with on-chain accumulation
Author  Beincrypto
Jun 30, Tue
XRP (XRP) price trades near $1.05, caught between a year-long downtrend and a sudden burst of buying.July has historically rewarded XRP holders. This year the month arrives with on-chain accumulation
placeholder
Gold Price Analysis Today: Gold Drops 1.32% Despite Lower Fed Rate-Hike Bets, Can $4,313 Support Hold? Gold fell 1.32% on August 13 after rising to $4,449.73, then reversing lower and closing near $4,349.918 below the $4,356.46 support. Softer US inflation data reduced Fed rate hike expectations, but selling pressure still dominated the session. Will $4,313 support hold?
Author  Naoufal Seddik
Aug 14, Fri
Gold fell 1.32% on August 13 after rising to $4,449.73, then reversing lower and closing near $4,349.918 below the $4,356.46 support. Softer US inflation data reduced Fed rate hike expectations, but selling pressure still dominated the session. Will $4,313 support hold?
placeholder
Gold Price Analysis Today: Gold Gains 0.94% as Markets Expect Fed to Hold Rates, Can $4,449 Resistance Break? Gold gained 0.94% on August 17, closing near $4,417.30 as softer US data strengthened expectations for unchanged Fed rates in September. Gold remains bullish, with $4,449.730 resistance and $4,310.650 support in focus.
Author  Naoufal Seddik
Aug 18, Tue
Gold gained 0.94% on August 17, closing near $4,417.30 as softer US data strengthened expectations for unchanged Fed rates in September. Gold remains bullish, with $4,449.730 resistance and $4,310.650 support in focus.
placeholder
Gold Price Analysis Today: Gold Rebounds After 1.91% Drop as Yields Ease. Is $4,449 Next? Gold fell about 1.91% on August 18 before producing a strong bullish reaction from the 1-hour demand zone in early August 19 trading. RSI is recovering from oversold conditions, but Supertrend remains bearish as traders await the Fed minutes.
Author  Naoufal Seddik
Aug 19, Wed
Gold fell about 1.91% on August 18 before producing a strong bullish reaction from the 1-hour demand zone in early August 19 trading. RSI is recovering from oversold conditions, but Supertrend remains bearish as traders await the Fed minutes.
goTop
quote