


Crypto Overview: Bitcoin tops $80,000 amid $6 billion options expiry – Ethena, Official Trump rally
- Bitcoin extends gains above $80,000 on Friday, gaining traction ahead of its $6.16 billion options expiry.
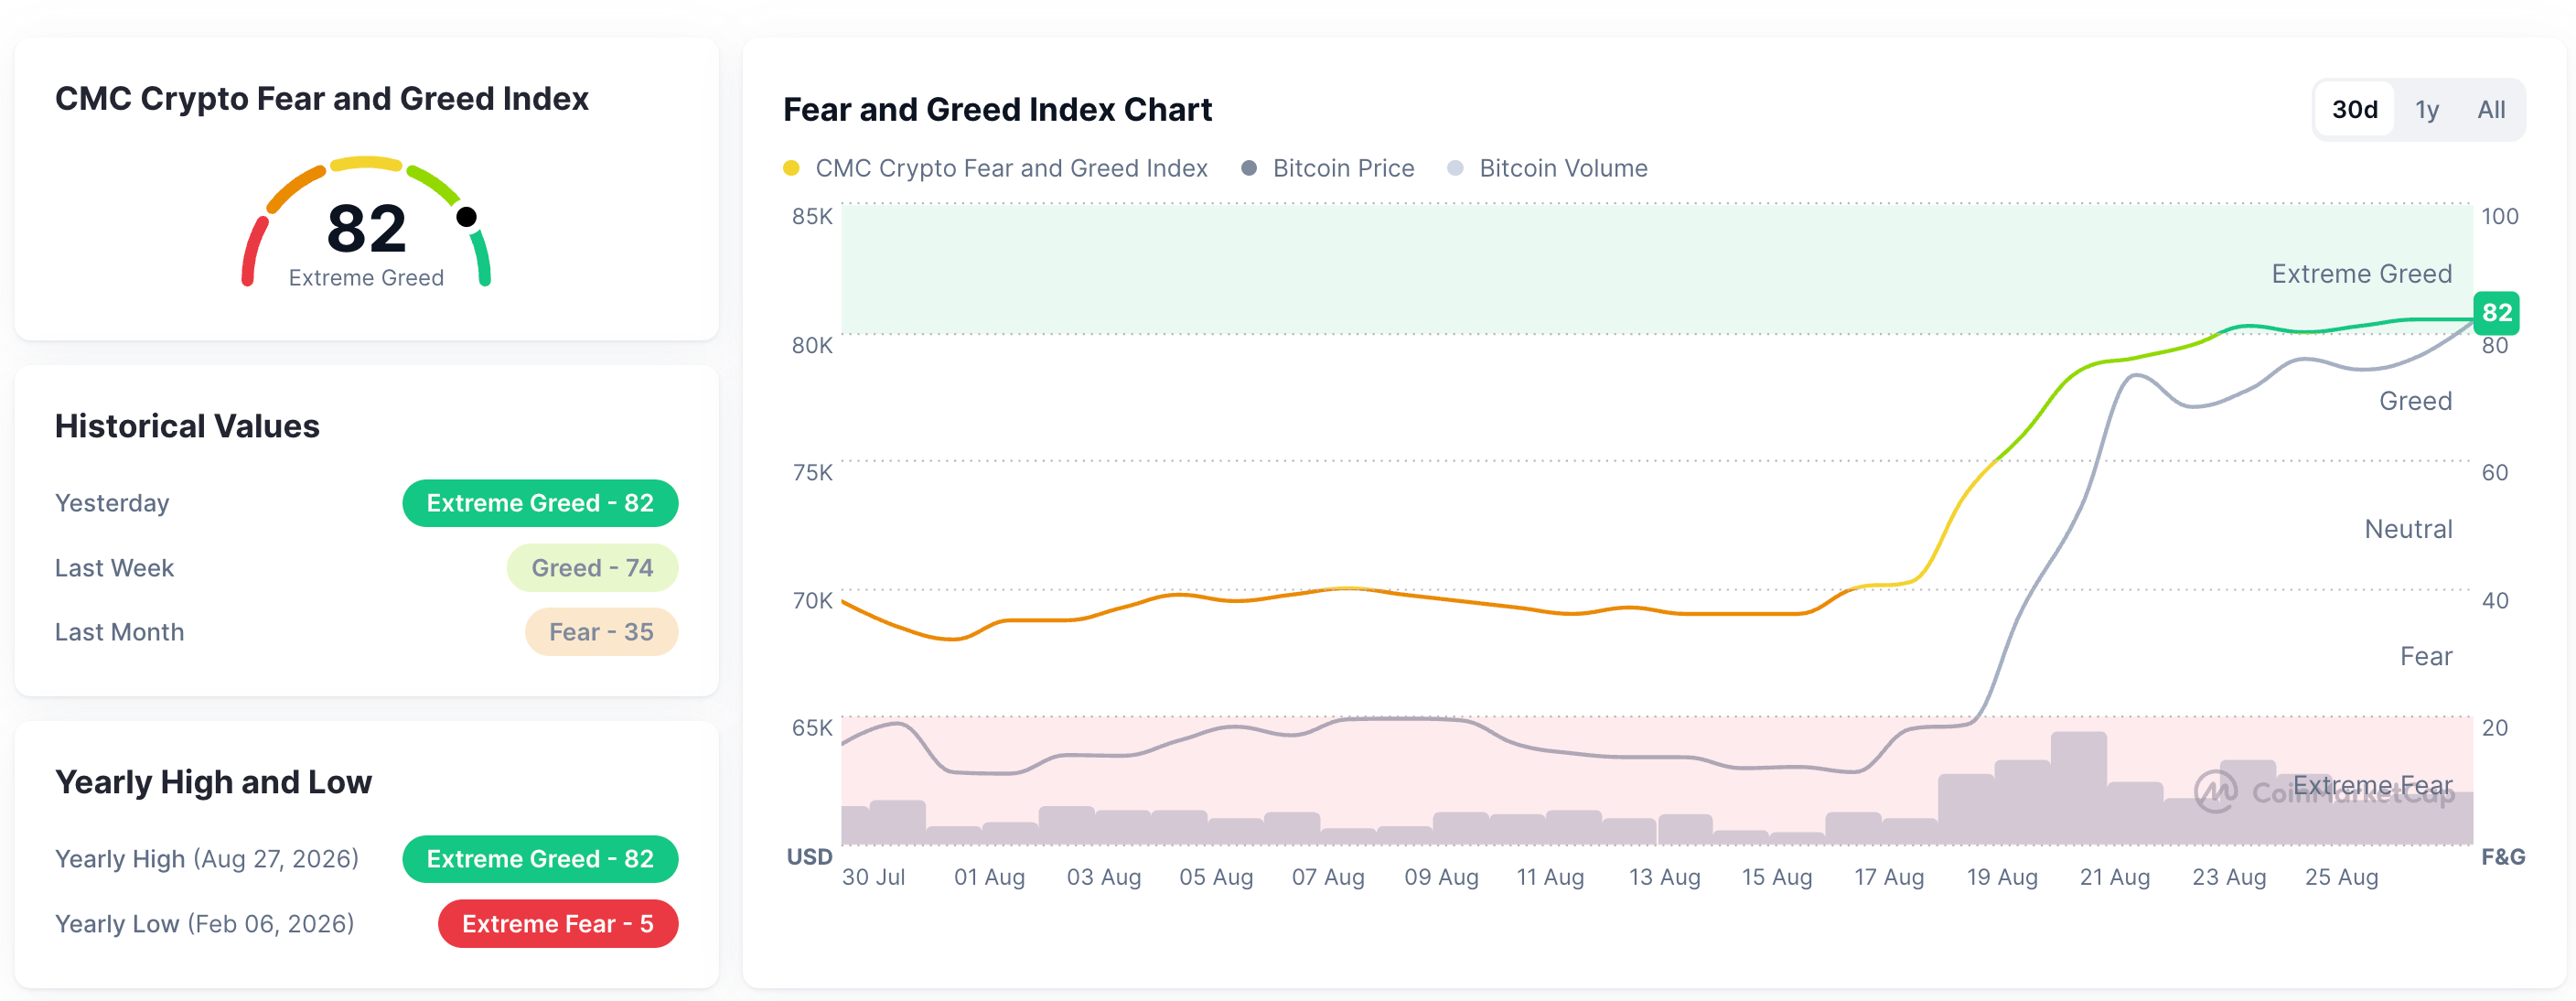
- Fear and Greed Index above 80 on Friday suggests strong risk-on sentiment among investors.
- Ethena and Official Trump emerge as top performers with double-digit gains over the last 24 hours.
The broader cryptocurrency market maintains a bullish character, with Bitcoin (BTC) advancing above $80,000 on Friday amid a $6.16 billion options expiry. Ethena (ENA) extends double-digit gains over the last 24 hours as Ethena Foundation announces buyback of early investors and revenue buyback. Official Trump also emerges as a top performer with double-digit gains, testing the bullish breakout of its 200-day EMA at $2.725.
CoinMarketCap’s Fear and Greed Index at 83 on Friday indicates a firm bullish sentiment in the crypto market.
Bitcoin’s rally faces over $6 billion options expiry
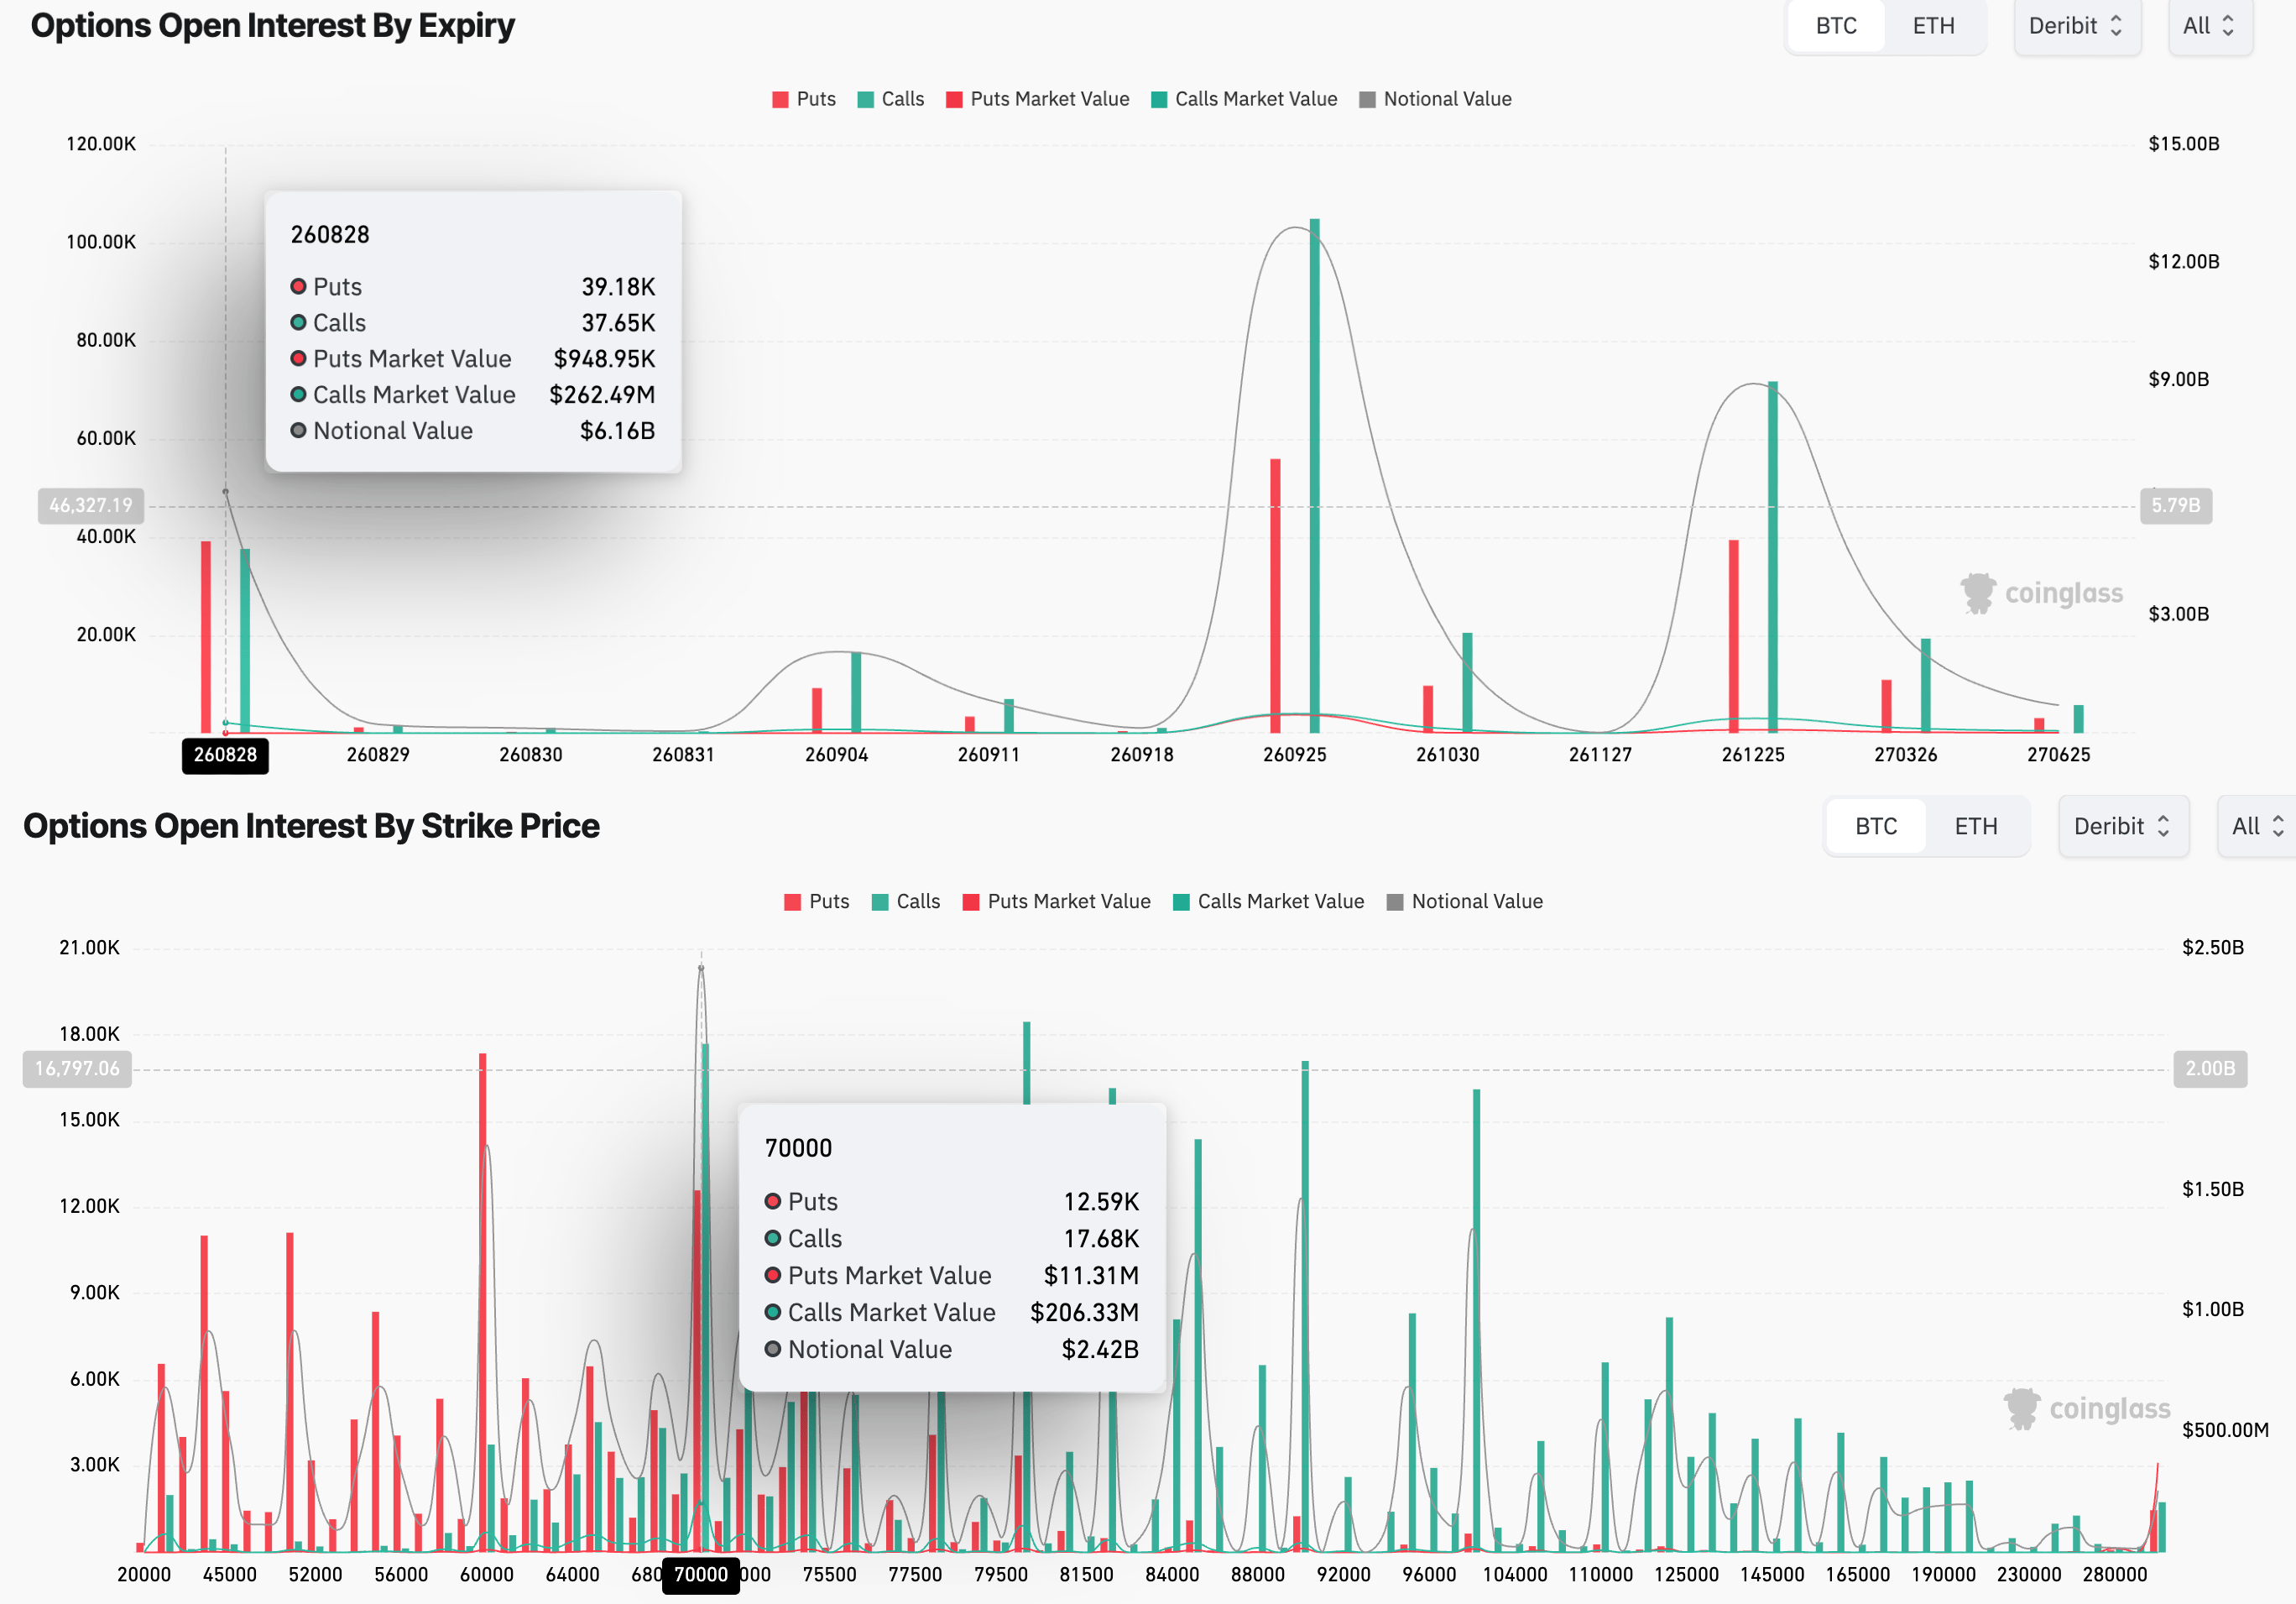
CoinGlass data shows that Bitcoin options Open Interest (OI) on Deribit stands at around $6.16 billion for Friday's expiry, driven by $948,950 in Puts and $262.49 million in Calls. The large difference between the actual values of Call and Put contracts and their notional values reflects the highly leveraged options market.
The max pain – the strike price with the largest volume of contracts – is at $70,000, with $2.42 billion in notional value, driven by $11.31 million in Puts and $206.33 million in Calls set to expire.
Bitcoin trades at $80,403 on Friday, maintaining a clear bullish bias as the price holds well above both the 50-day and 200-day Exponential Moving Averages, near $68,732 and $73,191, respectively.
Momentum remains overheated, with the Relative Strength Index (RSI) hovering deep in overbought territory around 82 and the Moving Average Convergence Divergence (MACD) still positive but losing altitude, suggesting that upside momentum could be slowing.
The immediate resistance for Bitcoin aligns with the March 13 swing high near $82,850. A confirmed breakout above this level could target the 127.2% Fibonacci extension level at $89,663, measured over the downswing from $82,850 to $57,800.
On the downside, the crucial support for Bitcoin aligns with the 78.6% Fibonacci retracement level at $77,489, followed by the 200-day EMA at $73,191.
Ethena rallies on early investors, revenue buyback
Ethena Foundation bought back locked ENA tokens from major seed investors, absorbing the supply pressure triggered by October 10 market-wide liquidations. Ethena also proposed allocating 95% of net revenue for ENA token buybacks after USDe reaches the first $7.5 billion supply milestone, as previously reported by FXStreet.
Ethena is up 9% on Friday, extending its 15% gain from the previous day. The DeFi token maintains a constructive bullish bias as the price sustains well above both 50-day and 200-day EMAs at $0.1068 and $0.1278, respectively.
The three consecutive days of recovery reflect a bounce back from the 50% retracement level at $0.1356 to the 78.6% retracement level at $0.1982, measured over the downswing from $0.2633 to $0.0699. A confirmed breakout above $0.1982 could target the previous swing high at $0.2633.
Momentum remains strong, with the MACD and signal line rising, and the RSI at 81 suggests overbought conditions that could slow the advance.
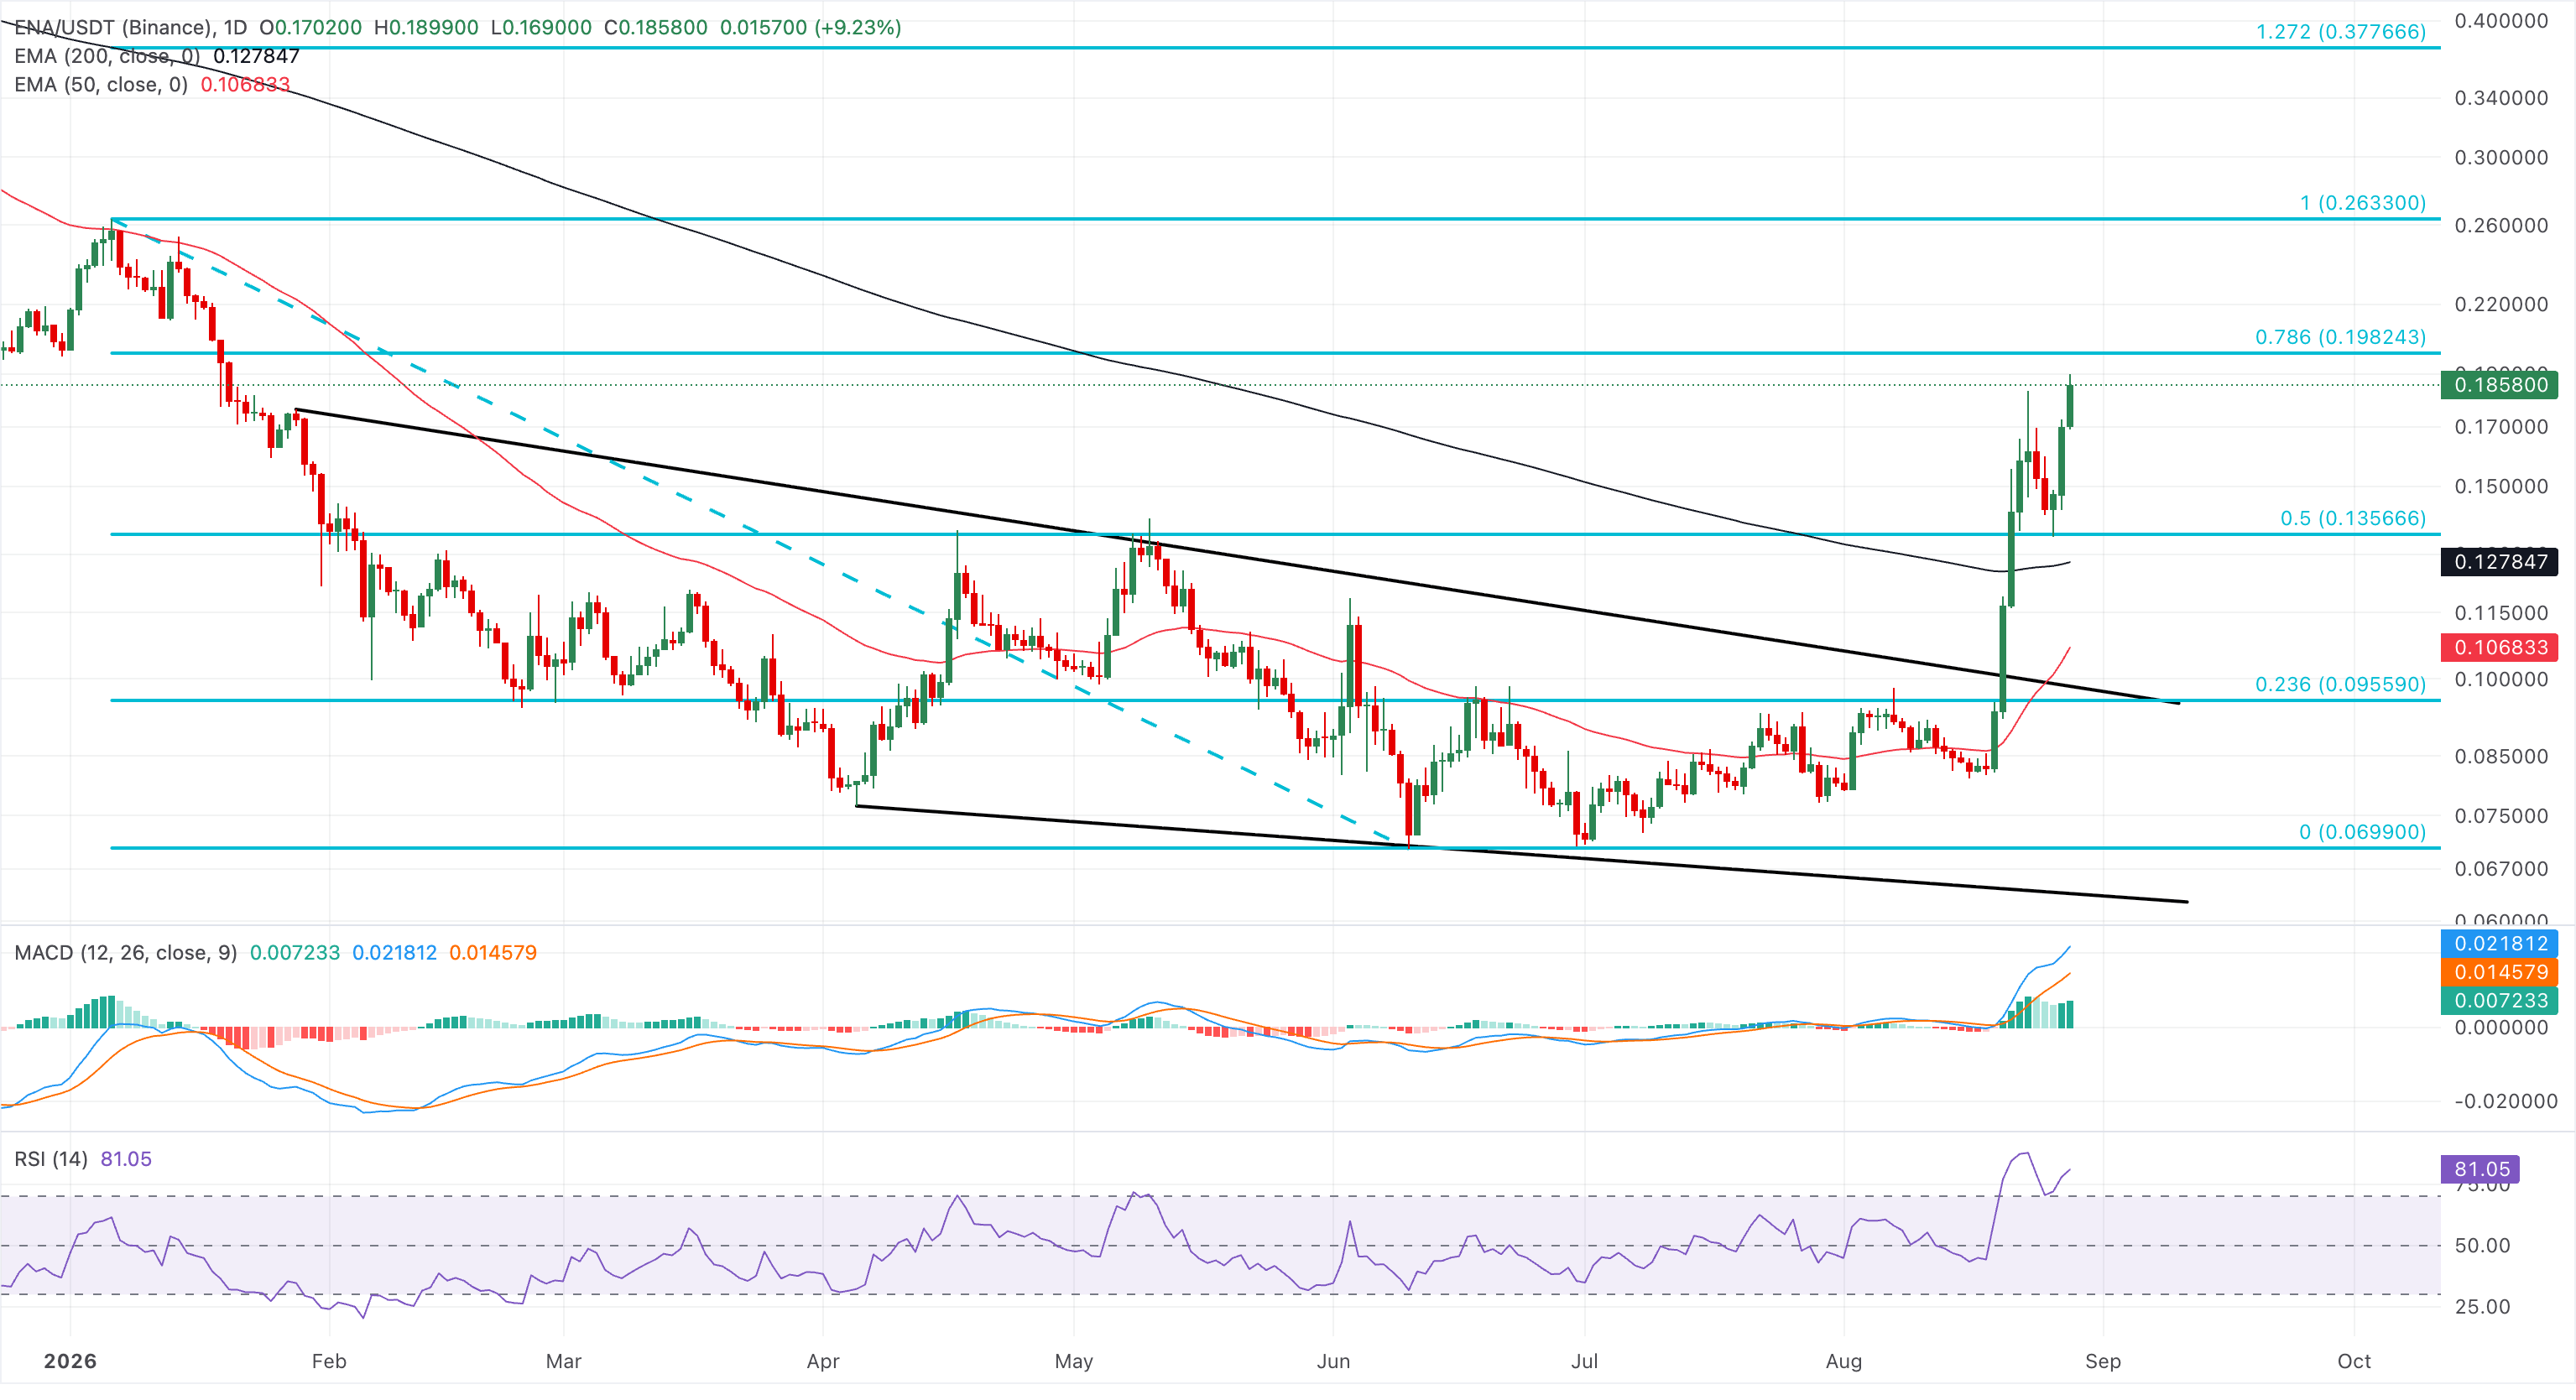
On the downside, initial support appears at the 50% retracement at $0.1356, reinforced by the 200-day EMA at $0.1278.
Official Trump tests 200-day EMA breakout
TRUMP trades at $2.7630 on Friday, keeping a bullish near‑term tone above both the 50‑day EMA at $1.7996 and the 200‑day EMA at $2.7067. The pair has also reclaimed the 50% retracement from $4.4970 to $1.365 at the $2.4775 level, reinforcing the constructive structure.
The MACD and signal line are steadily rising in the positive territory, while the RSI sits in overbought territory near 73, hinting that the latest rally could be vulnerable to bouts of profit‑taking.
A confirmed breakout of the 200-day EMA at $2.7067 could extend the TRUMP rally toward the 78.6% Fibonacci retracement level at $3.4843.
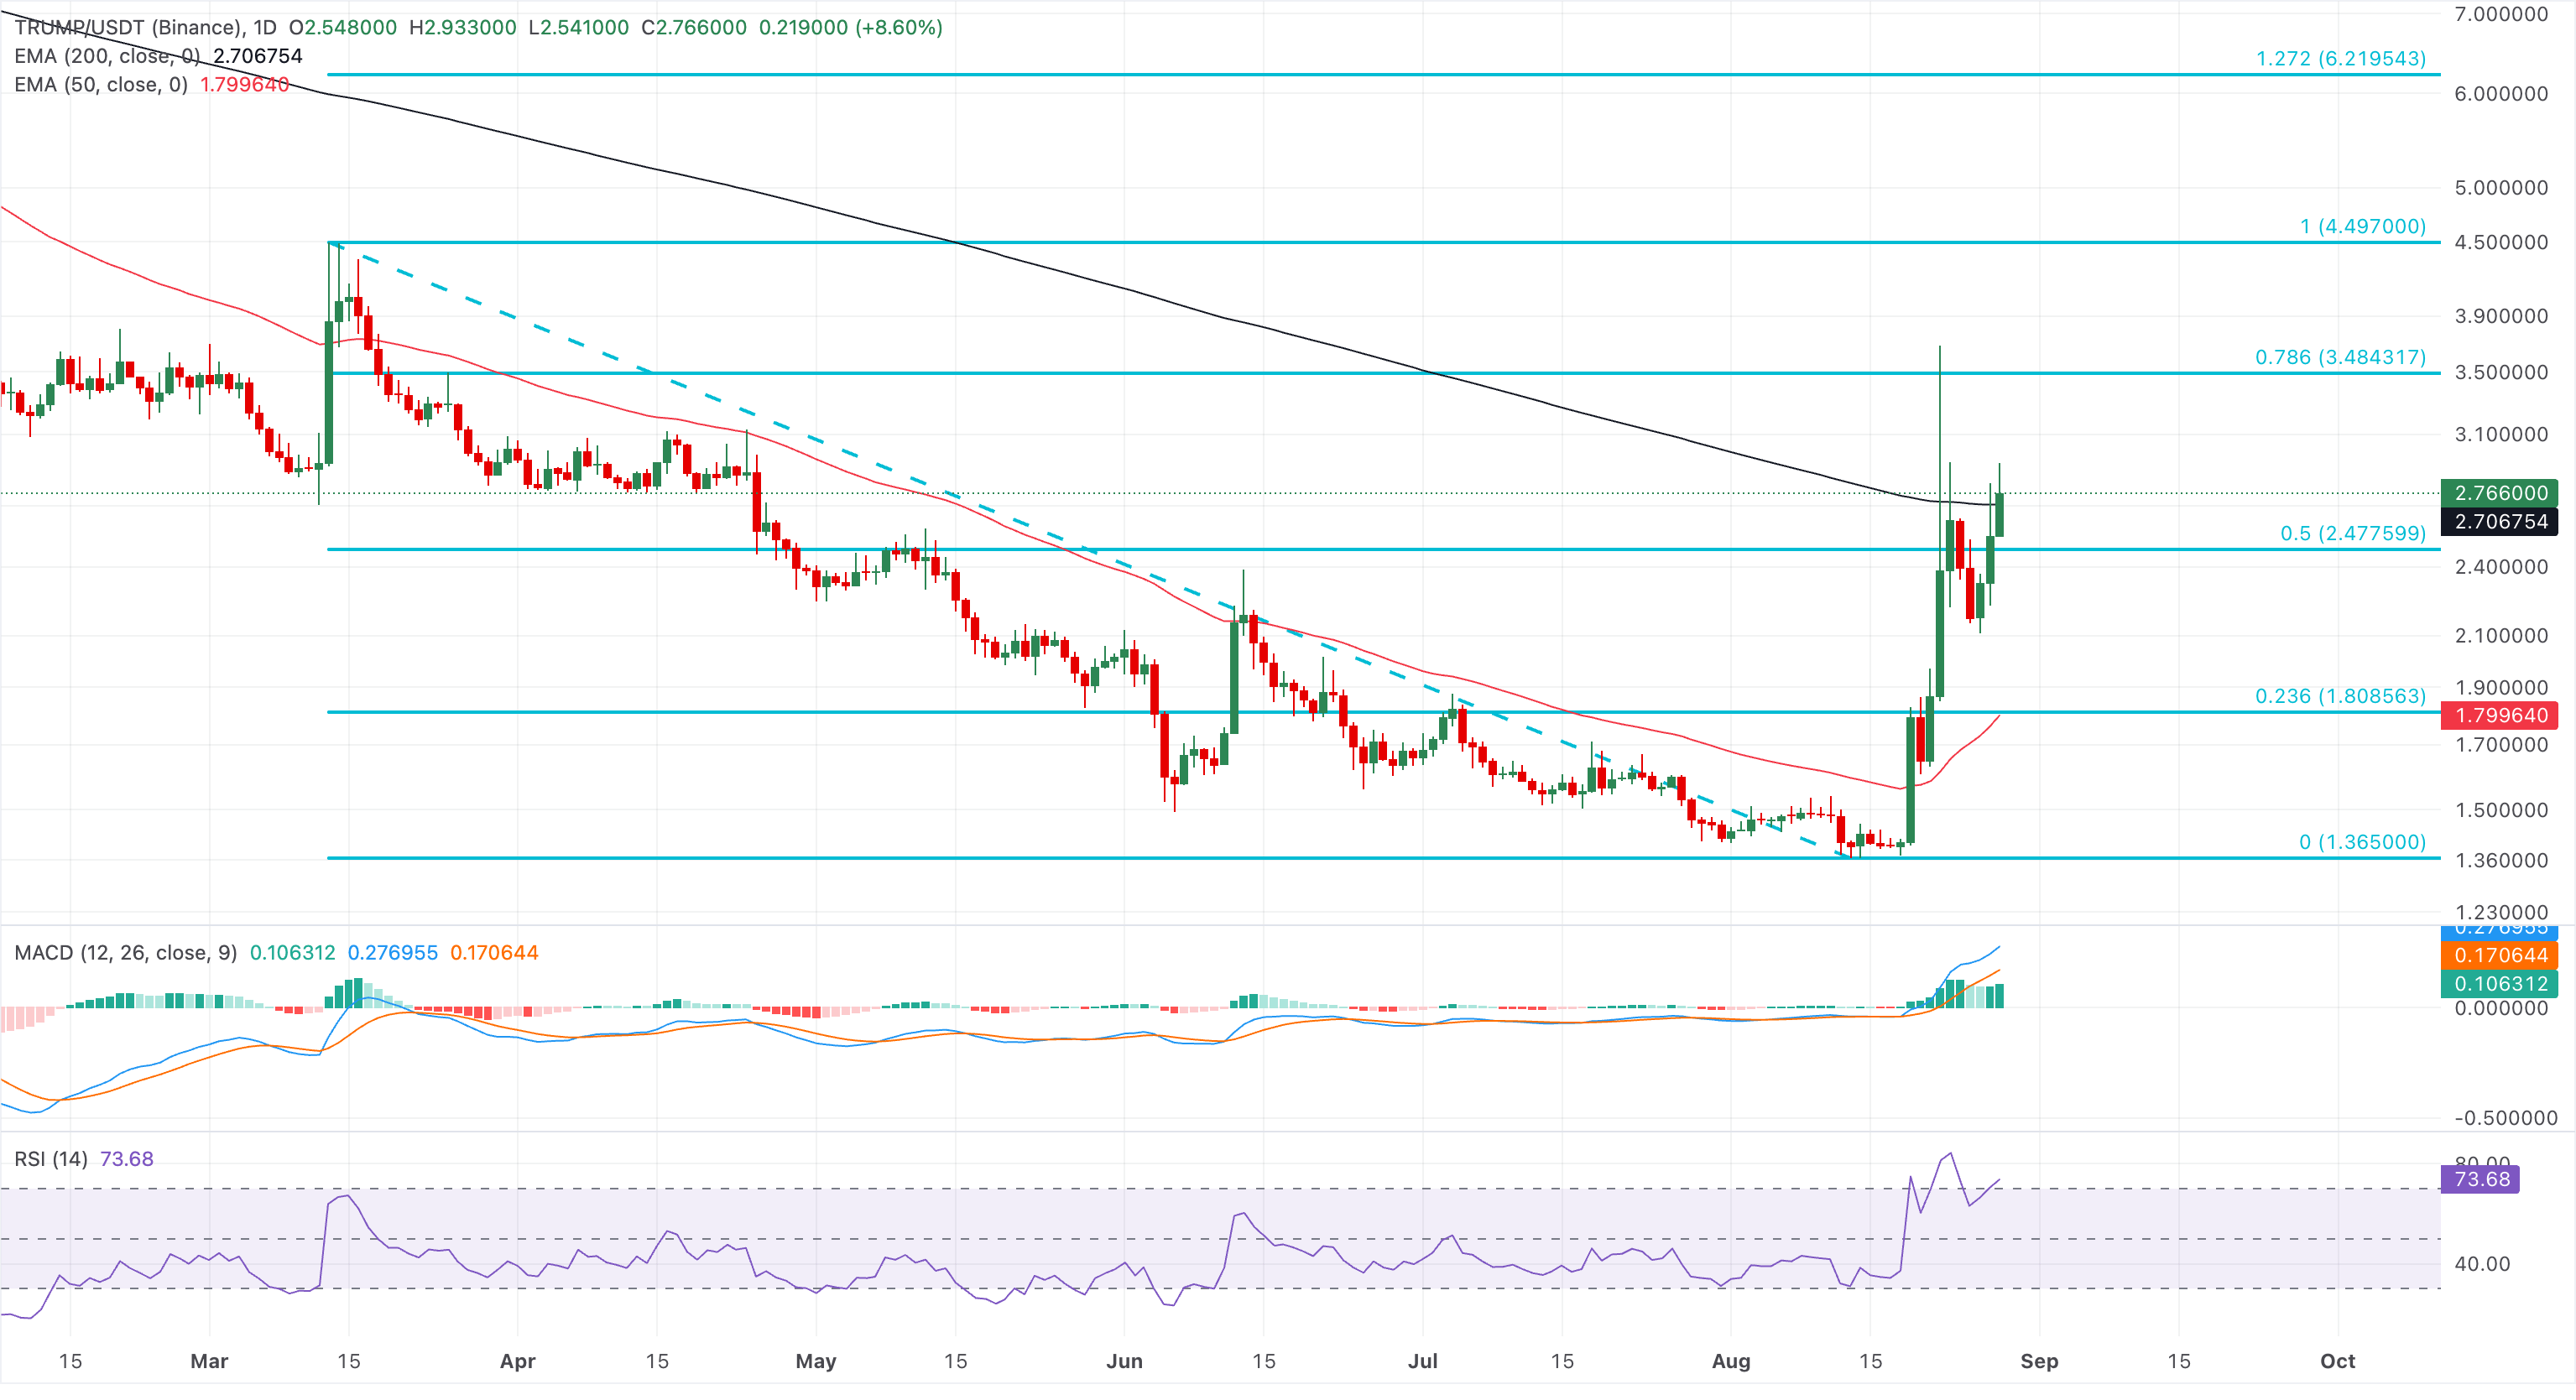
On the downside, immediate support is seen at the 50% retracement at $2.4775. A deeper pullback would expose the 23.6% retracement at $1.8085, reinforced by the 50‑day EMA near $1.7996.
(The technical analysis of this story was written with the help of an AI tool. Know more.)
Recommended Articles


