


Bitcoin Price Forecast: BTC extends gains as investors shift to debasement-resistant assets
- Bitcoin extends rally toward $80,000 amid persistent bullish momentum.
- BTC's long-term growth depends on its debasement-resistant narrative amid rising ETF inflows, an analyst says.
- Bitcoin’s SOPR indicator above 1 signals mild profit-taking, and a continued trend could suggest steady price growth as buyers absorb supply.
Bitcoin (BTC) is extending its rally toward $80,000 on Thursday, maintaining its steady gains from last week. Eric Balchunas, a Bloomberg ETF analyst, points to rising demand for Bitcoin amid a broader market debasement. Bitcoin’s Spent Output Profit Ratio (SOPR) indicator above 1 suggests that investors are starting to take profits after the recent recovery.
The technical outlook for Bitcoin is to the upside, with bulls eyeing a confirmed breakout of the $80,000 mark.
Bitcoin’s growth as a debasement-resistant asset
Debasement trades are a strategic shift in investment, typically seen amid expectations that money or other financial assets will lose their value. Elevated US inflation and debt above $40 trillion fuel debasement trade, shifting demand toward scarce assets, Gold and Bitcoin.
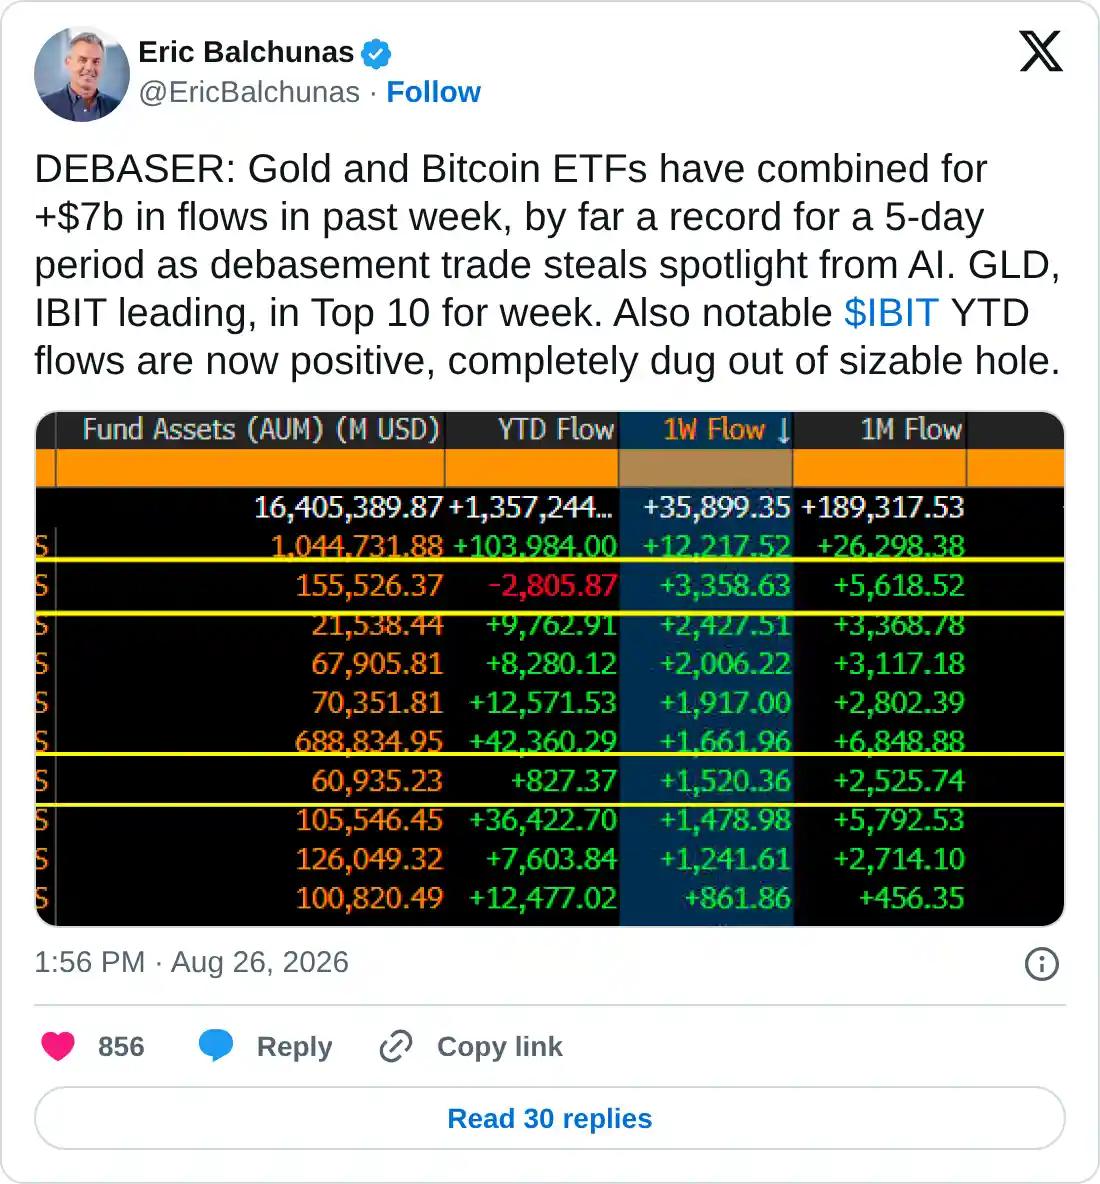
Eric Balchunas, Senior ETF analyst at Bloomberg, highlighted renewed institutional demand for Gold and Bitcoin in an X post on Wednesday. Balchunas shared data showing that Gold and Bitcoin Exchange-Traded Funds (ETFs) have combined for over $7 billion in flows over the last week, marking a record-high 5-day inflow, with the debasement trade as the key catalyst, drawing capital away from AI.
Balchunas also pointed out that Bitcoin’s next rally could focus on its “debasement-resistant” identity, shifting away from short-term narratives such as the CLARITY Act, ETF adoption, and Strategy’s BTC treasury flows.
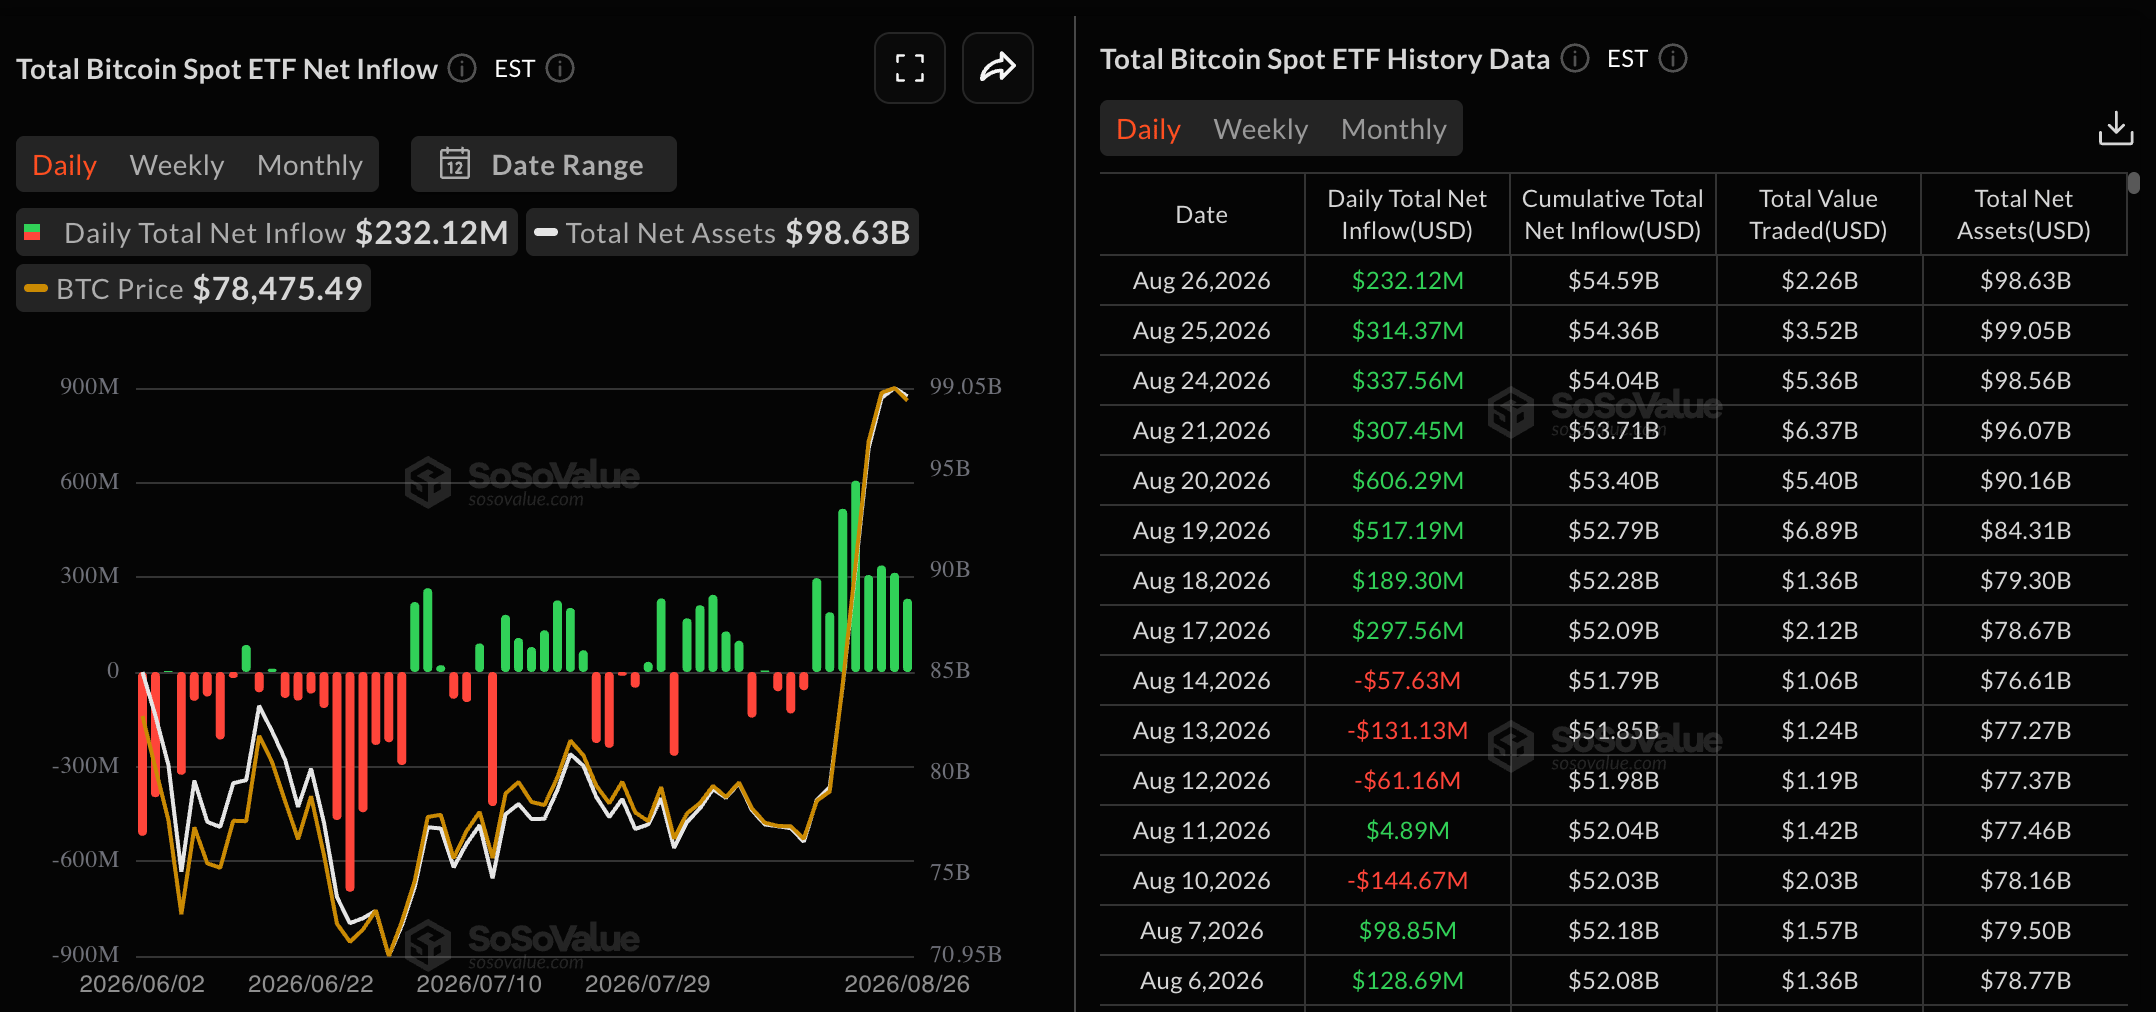
SoSoValue data shows BTC ETFs recorded $232.12 million in inflows on Wednesday, extending their positive streak for the eighth consecutive day.
Profit-taking begins
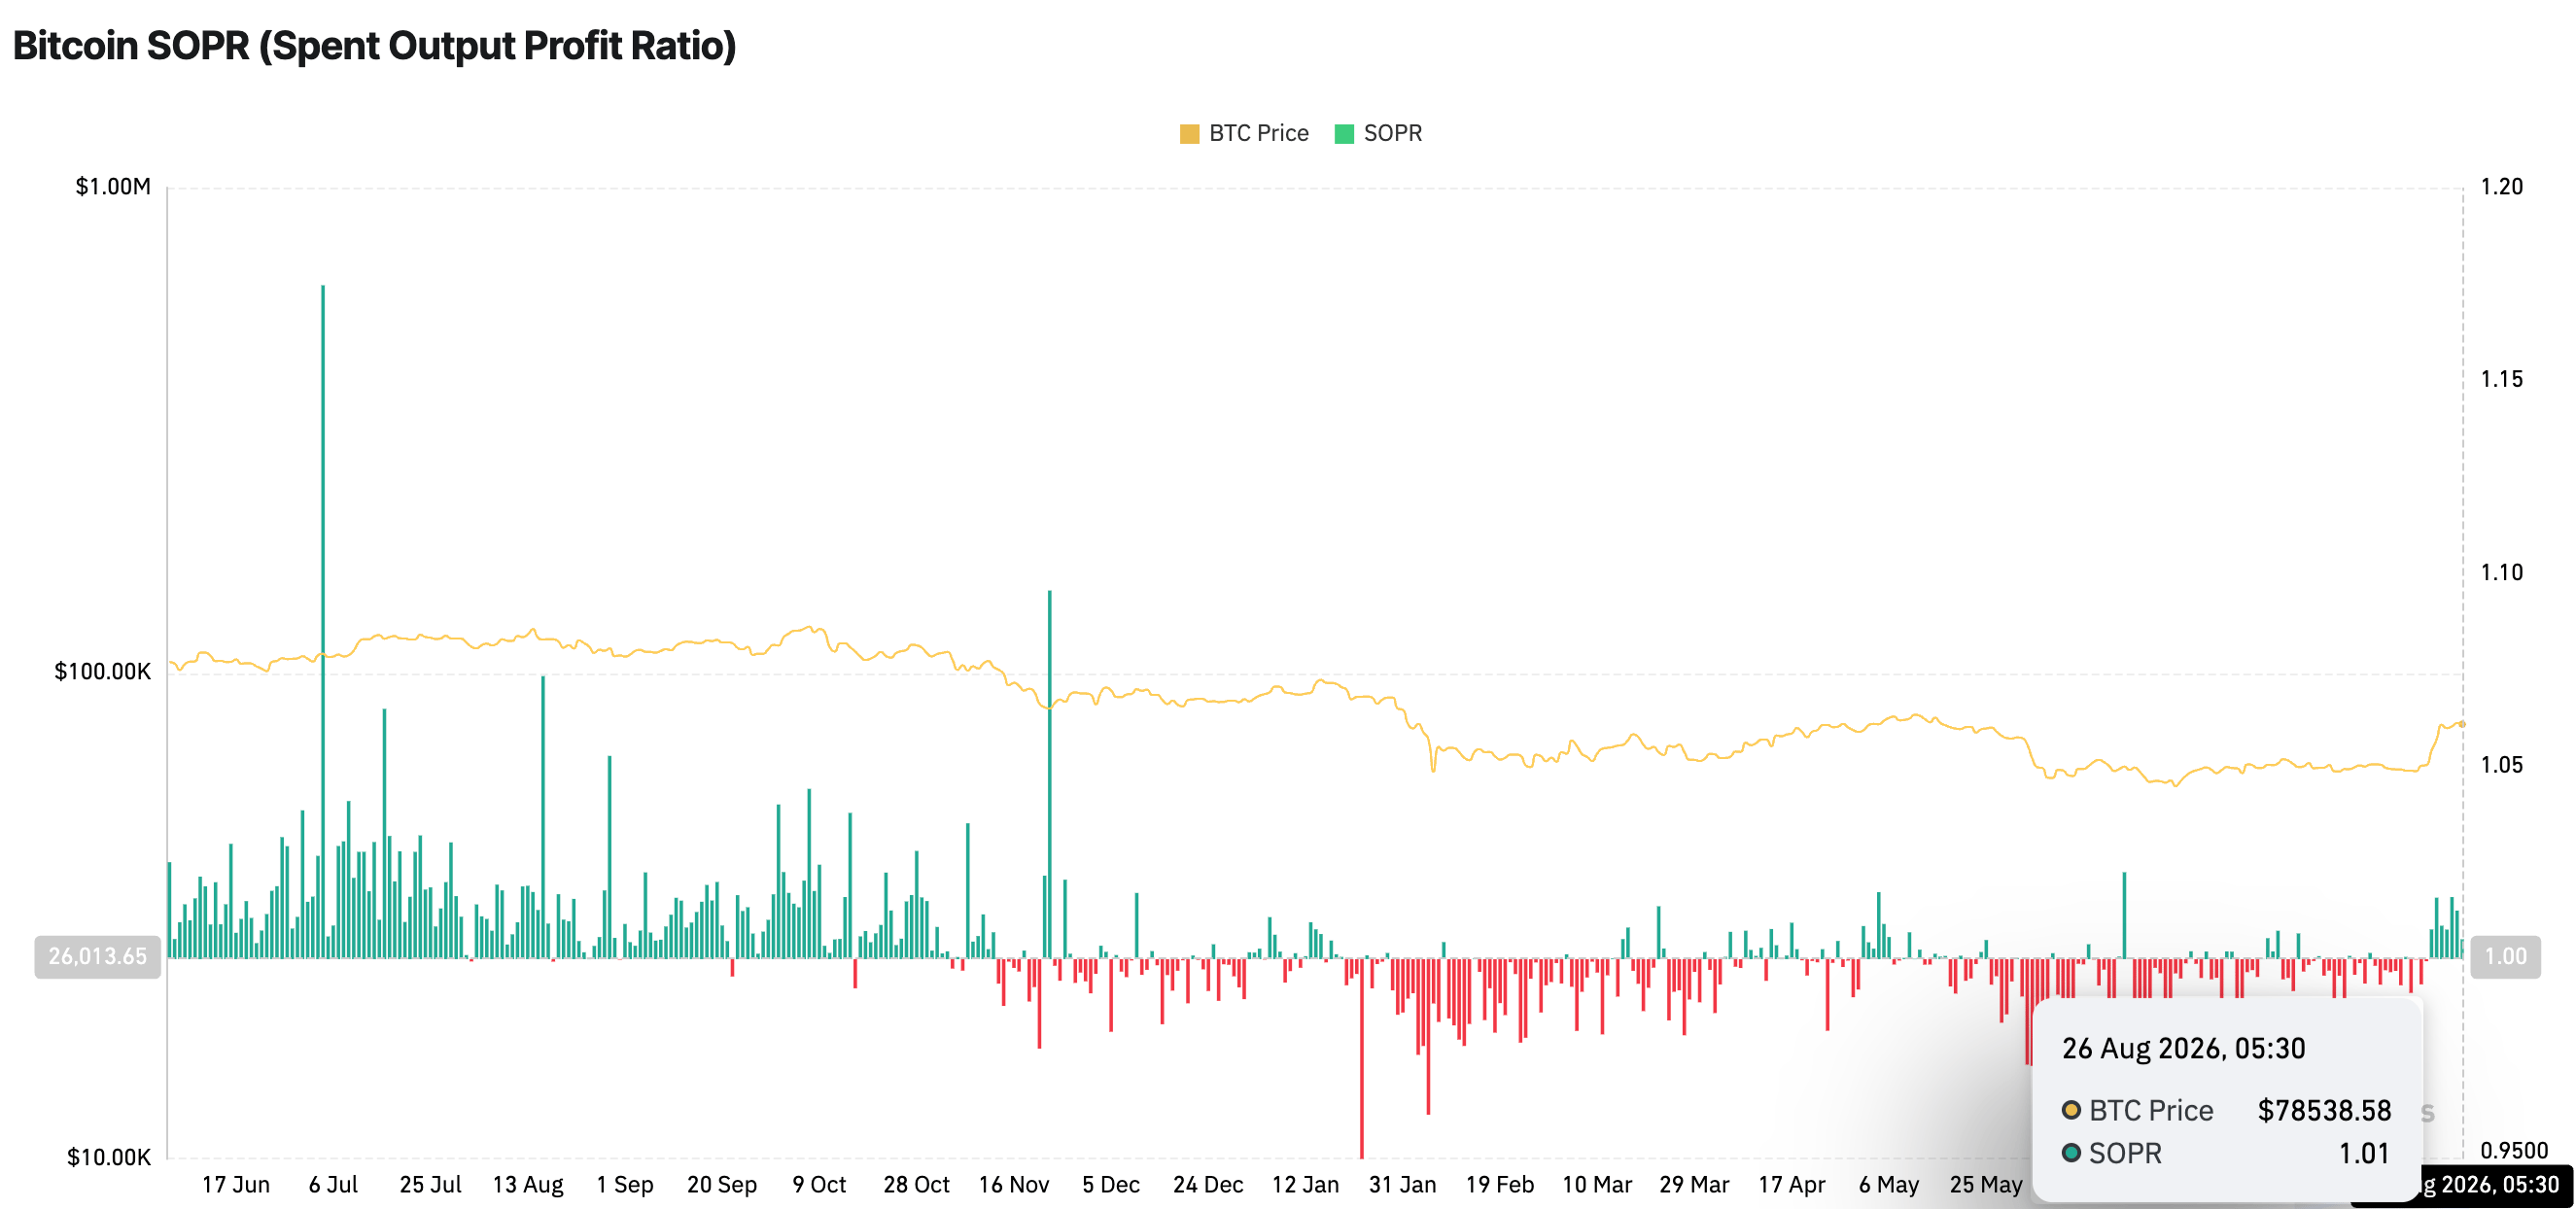
Bitcoin’s Spent Output Profit Ratio (SOPR) – ratio of the price of spent Bitcoin to its originally acquired price – hovers around 1.01 after flipping above 1 on August 20, suggesting that holders have started to take profit. Typically, a sustained SOPR above 1 reflects a steady recovery in BTC as buyers continue to absorb the supply pressure.
Technical outlook: Bitcoin struggles to advance beyond $80,000
Bitcoin trades around $79,964 on Thursday, preserving a strong bullish bias as price holds well above the 50-day and 200-day Exponential Moving Averages (EMAs) at $68,242 and $72,025, respectively.
The King Crypto is also firmly above the 78.6% Fibonacci retracement of the $82,850 to $57,800 downswing at $77,489, underpinning the latest advance. A confirmed breakout above the $80,000 round figure would position $82,850 as the next bullish target, followed by the 127.2% Fibonacci extension level at $89,663.
Momentum remains stretched, with the Relative Strength Index (RSI) at 81 on the daily chart, continuing to extend within overbought territory. At the same time, the Moving Average Convergence Divergence (MACD) is cooling but still positive, suggesting that upside pressure persists.
On the downside, initial support is seen at the 78.6% Fibonacci retracement at $77,489. Deeper declines would bring the 200-day EMA at $72,025 and the 50.0% retracement at $70,325 into view, while any slide toward the 50-day EMA at $68,242 would likely attract dip buying.
(The technical analysis of this story was written with the help of an AI tool. Know more.)
Recommended Articles


