


Crypto Market Overview: Bitcoin holds above $77,000 – PENGU and AAVE eye further gains
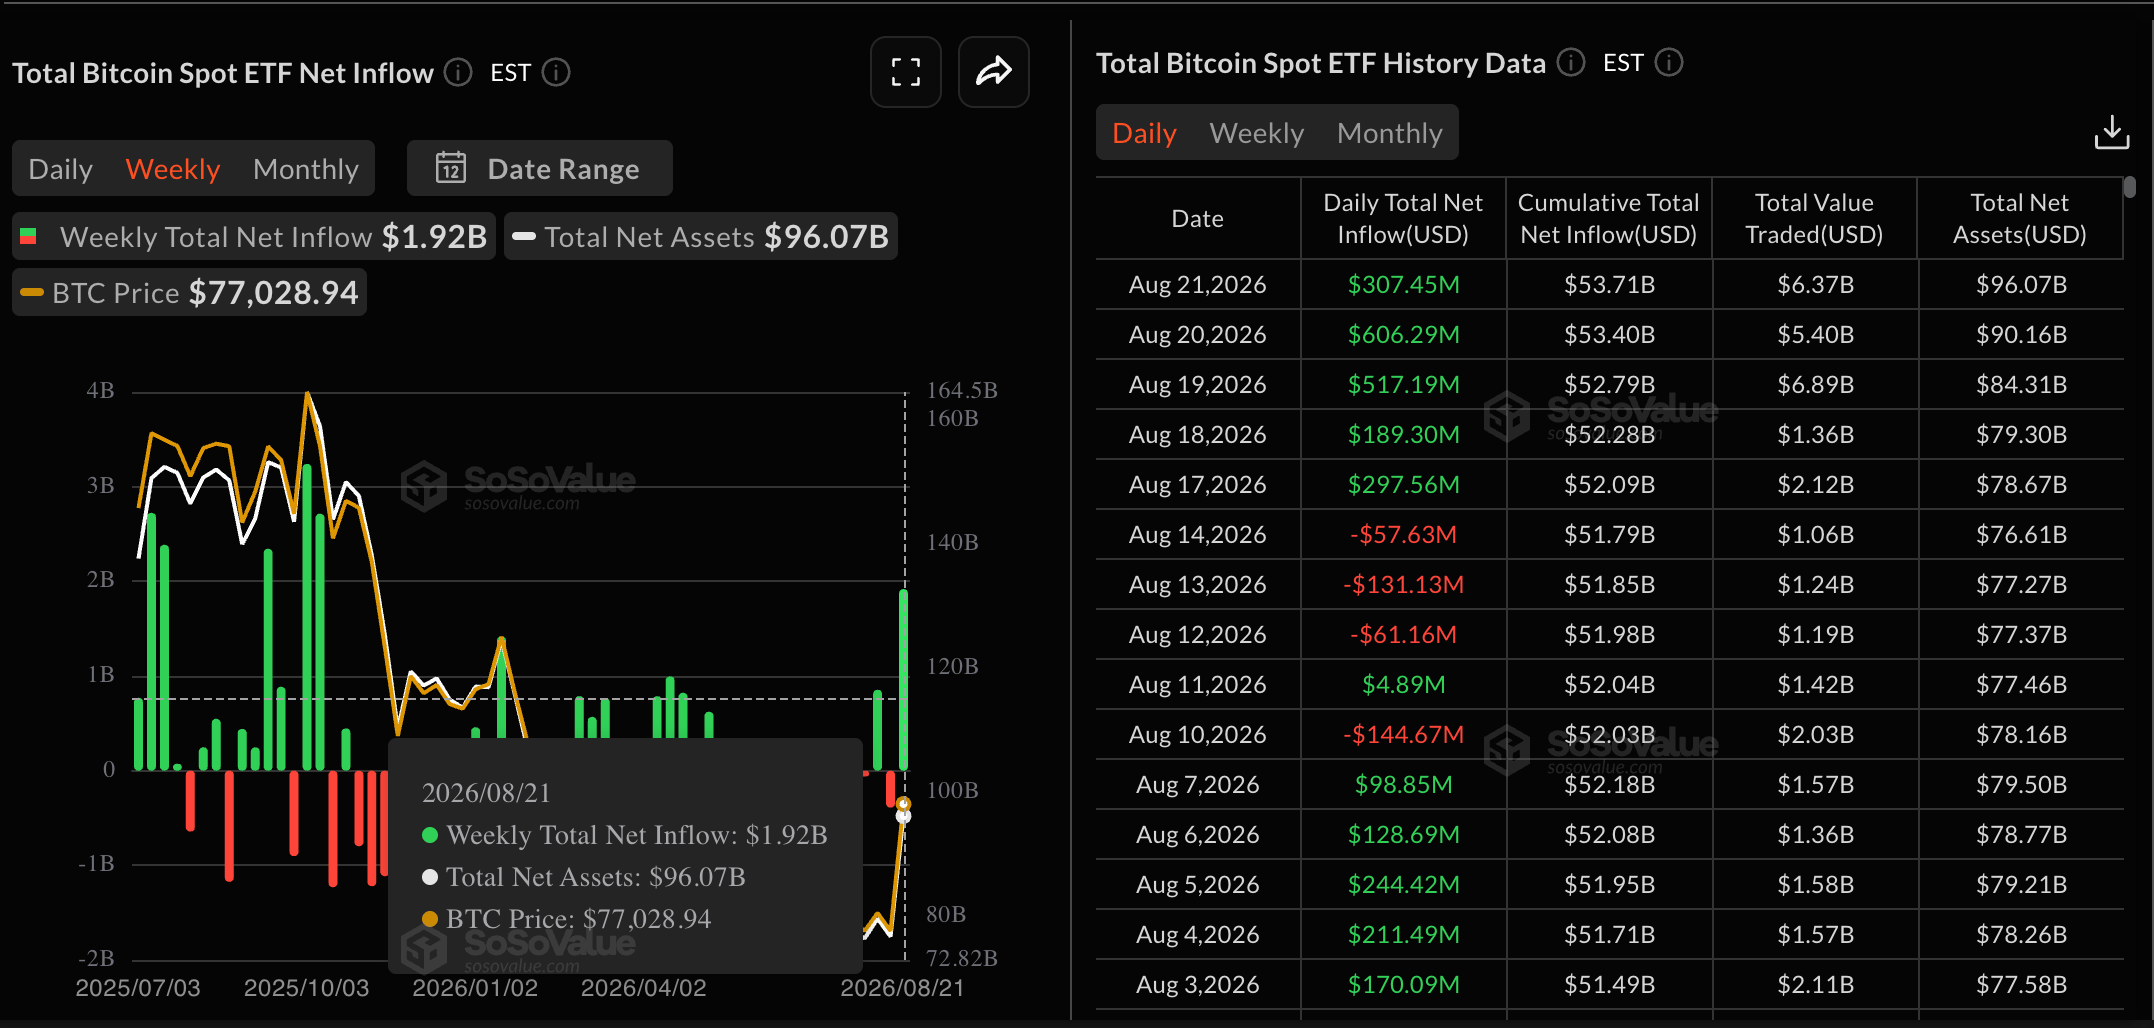
- Bitcoin edges lower on Monday after a 23% rally last week amid $1.92 billion in weekly ETF inflows.
- Crypto Fear and Greed Index reading of 78 indicates risk-on sentiment.
- Pudgy Penguins and Aave emerge as top performers over the last 24 hours.
The broader cryptocurrency market is gaining momentum with Bitcoin (BTC) above $77,000 on Monday, holding its 23% gains from last week. Renewed institutional demand, with $1.92 billion in inflows last week, the largest so far in 2026, backs the risk-on sentiment. Pudgy Penguins (PENGU) and Aave (AAVE) have emerged as top performers over the last 24 hours.
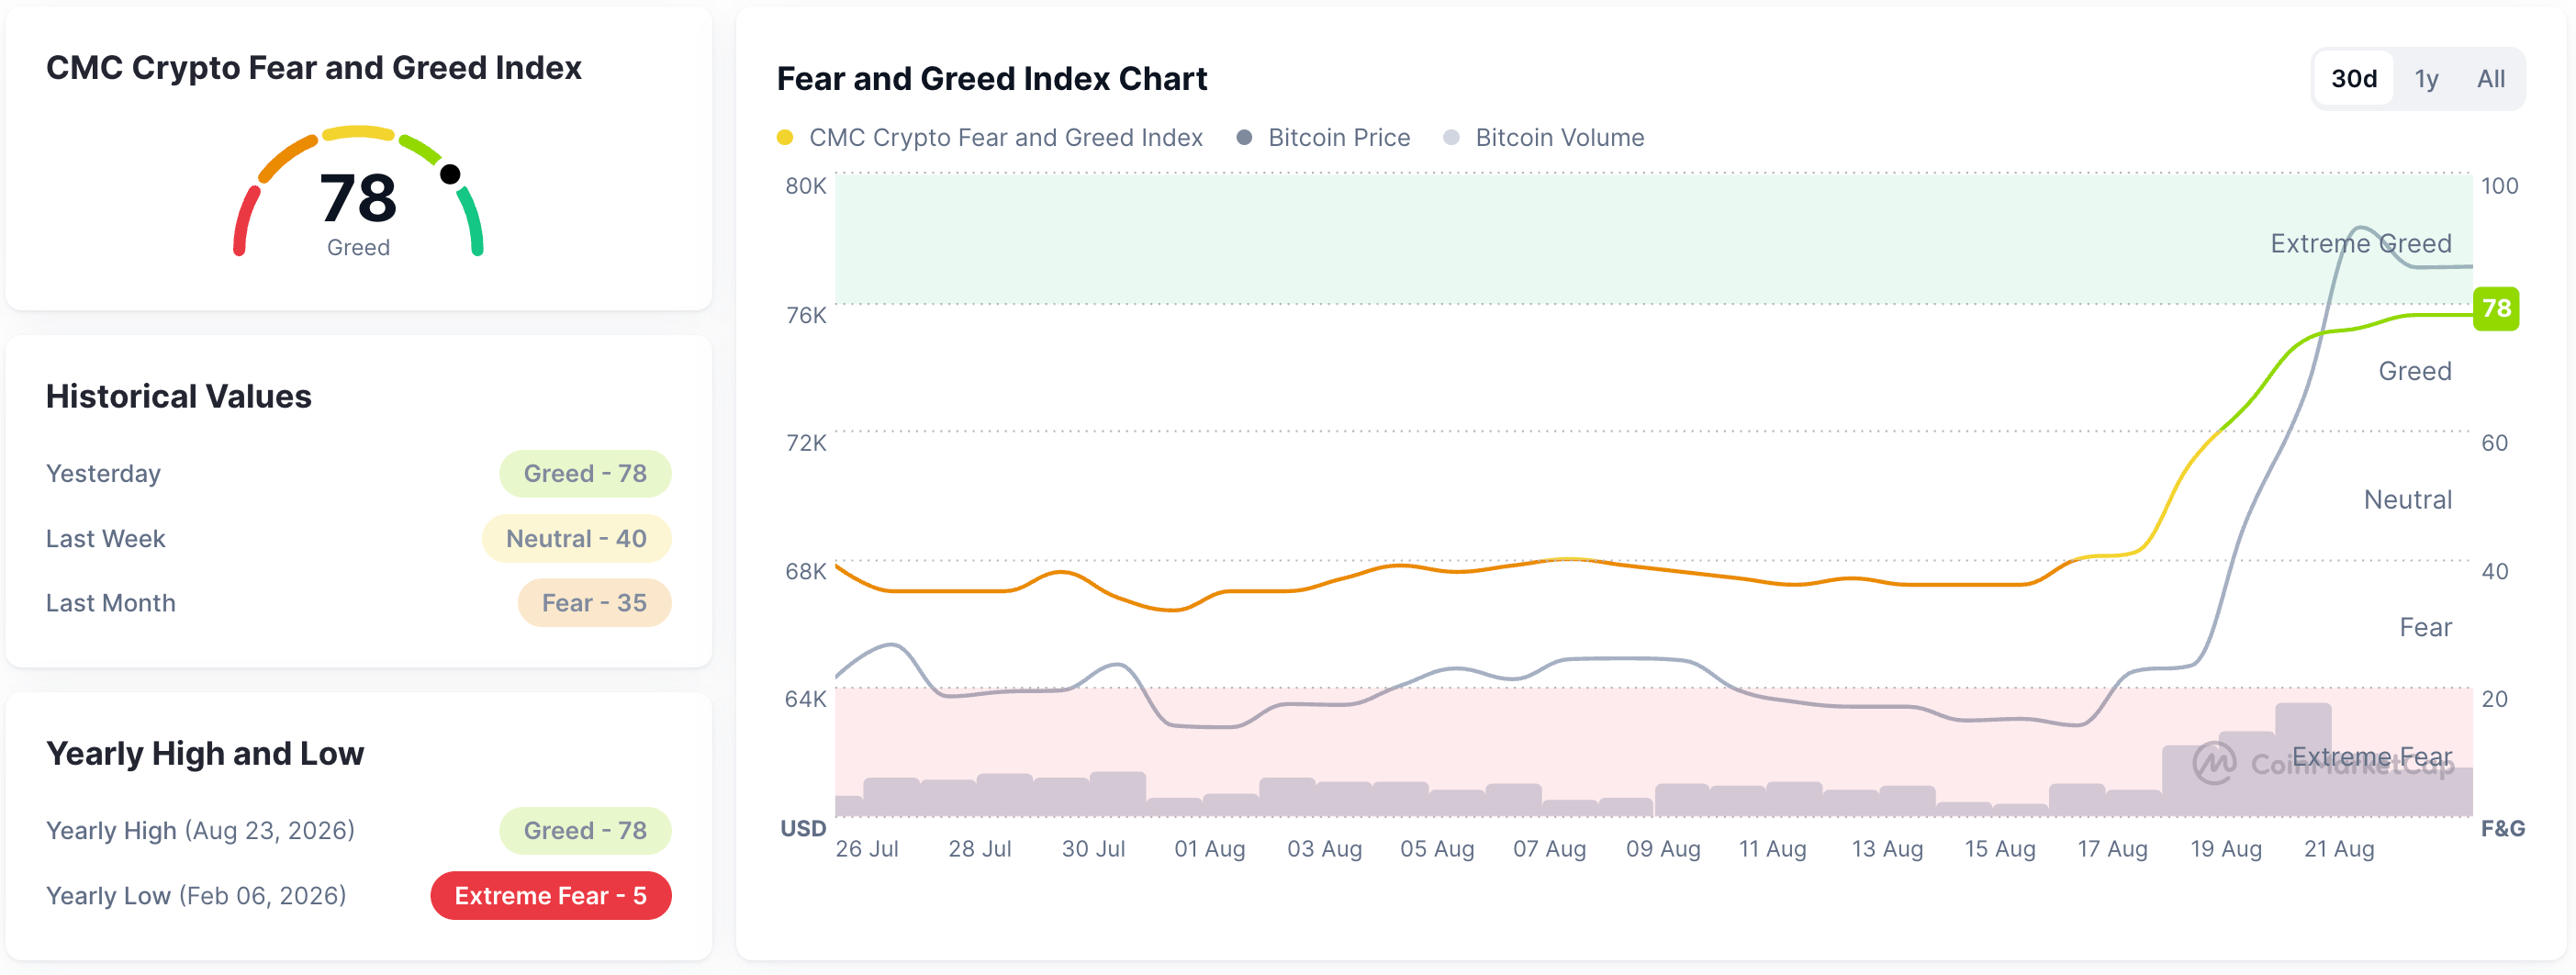
CoinMarketCap’s Fear and Greed Index at 78 on Monday reaffirms the improving risk appetite of crypto investors.
Technical outlook: Will Bitcoin rally extend above $80,000?
Bitcoin edges lower on Monday, following a 23% jump last week. BTC maintains a strong bullish near-term bias as price holds well above both the 50-day Exponential Moving Average (EMA) at $66,769 and the 200-day EMA at $72,636.
In addition, last week's rally was accompanied by $1.92 billion in inflows into BTC-focused Exchange Traded Funds (ETFs), marking the largest weekly flow so far in 2026. This renewed institutional demand improves the odds of an extended Bitcoin rally.
From a technical perspective, the 78.6% Fibonacci retracement level of the downswing from $82,850 to $57,800, at $77,489, serves as the immediate resistance. A decisive close above this level could extend a rally above the $80,000 mark, testing the $82,850 swing high from May 15.
Momentum remains robust but stretched, as the Relative Strength Index (RSI) at 77 sits in overbought territory and the Moving Average Convergence Divergence (MACD) stays firmly positive, hinting that the uptrend remains intact.
On the downside, initial support is seen at the 200-day EMA nearby at $72,636, followed by the 50% retracement at $70,325 and the 50-day EMA at $66,769.
Technical outlook: Could PENGU and AAVE extend their rally?
Pudgy Penguins hovers around $0.009400 at press time on Monday, following a 17% rally the previous day. PENGU holds a bullish near-term bias as it trades above both the 50-day EMA at $0.006756 and the 200-day EMA at $0.008108.
The rally remains constrained by the $0.01000 psychological threshold, resulting in a retest of the 50% retracement of the downswing from $0.01380 to $0.005275, at $0.009542. Momentum remains constructive, with the MACD rising in positive territory, but the RSI near 72 suggests overbought conditions.
Looking up, a confirmed breakout above $0.01000 could target the 78.6% Fibonacci retracement level at $0.01198.
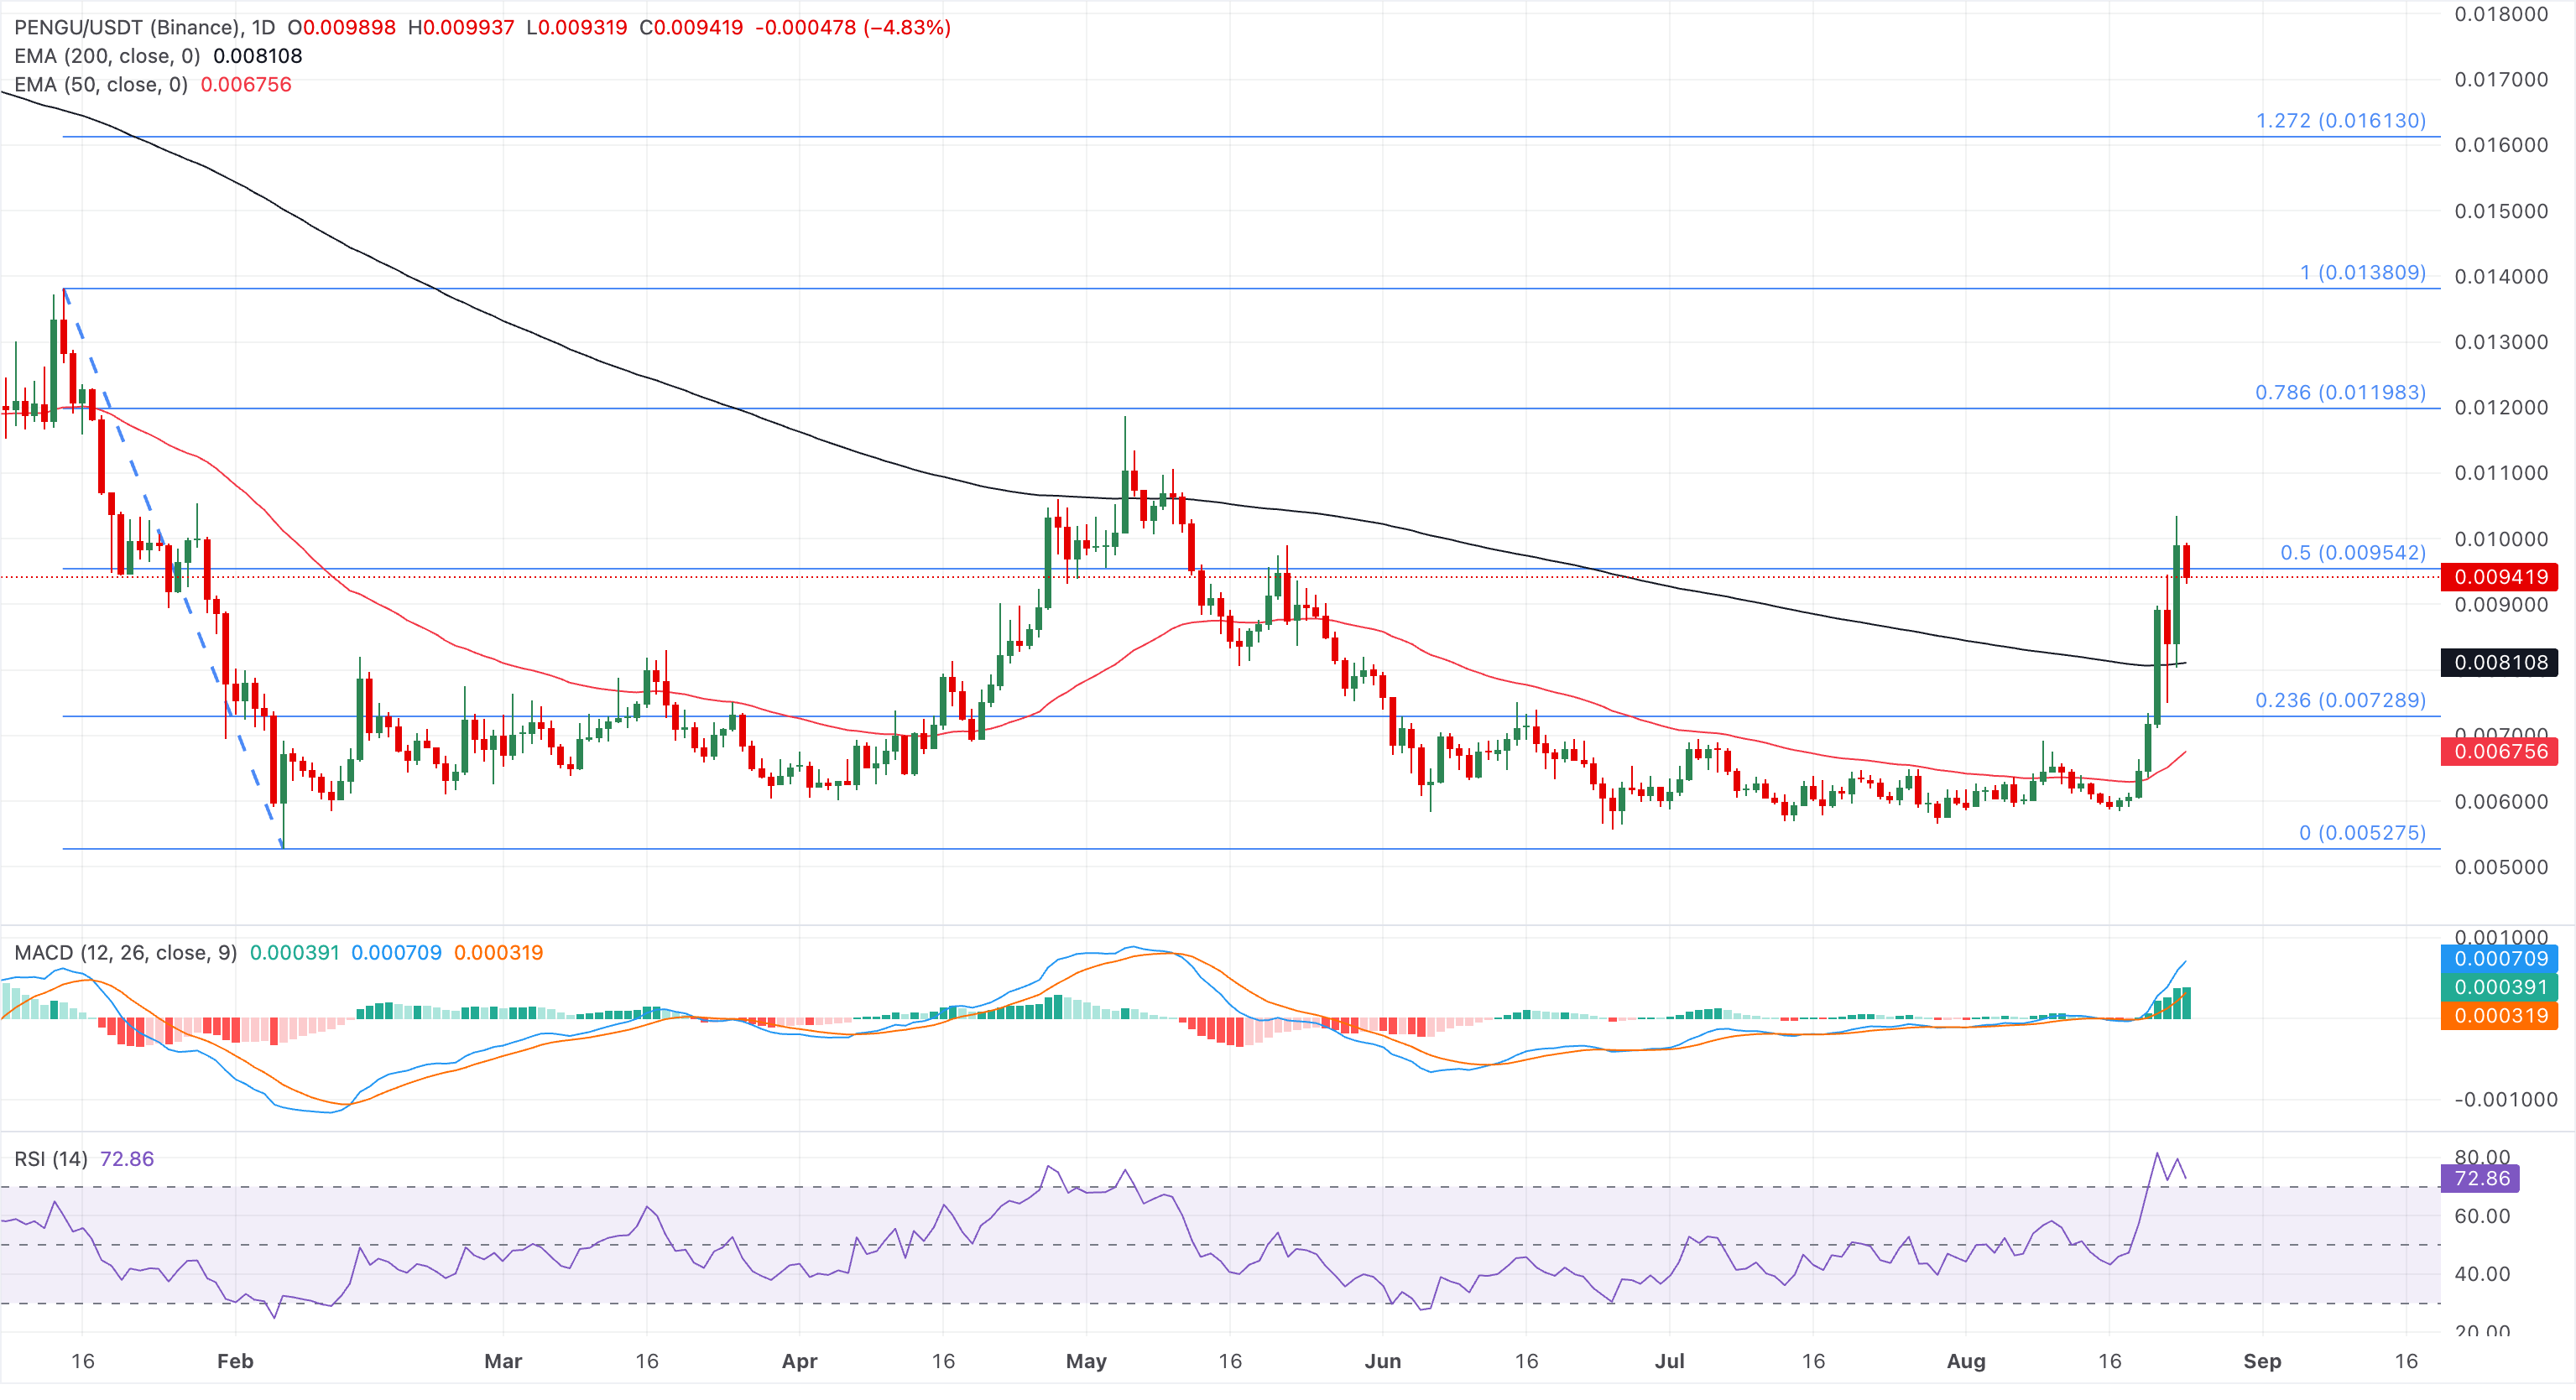
Initial support is located at the reclaimed 200-day EMA at $0.008108 and the 23.6% retracement at $0.007289, with deeper bearish pressure likely needed to challenge the 50-day EMA at $0.006756.
Aave trades around $137 on Monday, extending a strong bullish phase after reclaiming the 50-day EMA at $96.51 and the 200-day EMA at $108.49 as underlying support. Price now tests the 50% retracement at $149.40 of the broader downswing from $385.99 to $57.83, with bulls eyeing a potential upside breakout.
The RSI at 80 signals overbought conditions, and the MACD and signal line show a firmly positive slope, with an expanding bullish profile, reinforcing the constructive momentum backdrop.
Looking up, AAVE must secure a daily close above $149.40 to extend the rally toward the 78.6% Fibonacci retracement at $257.12.
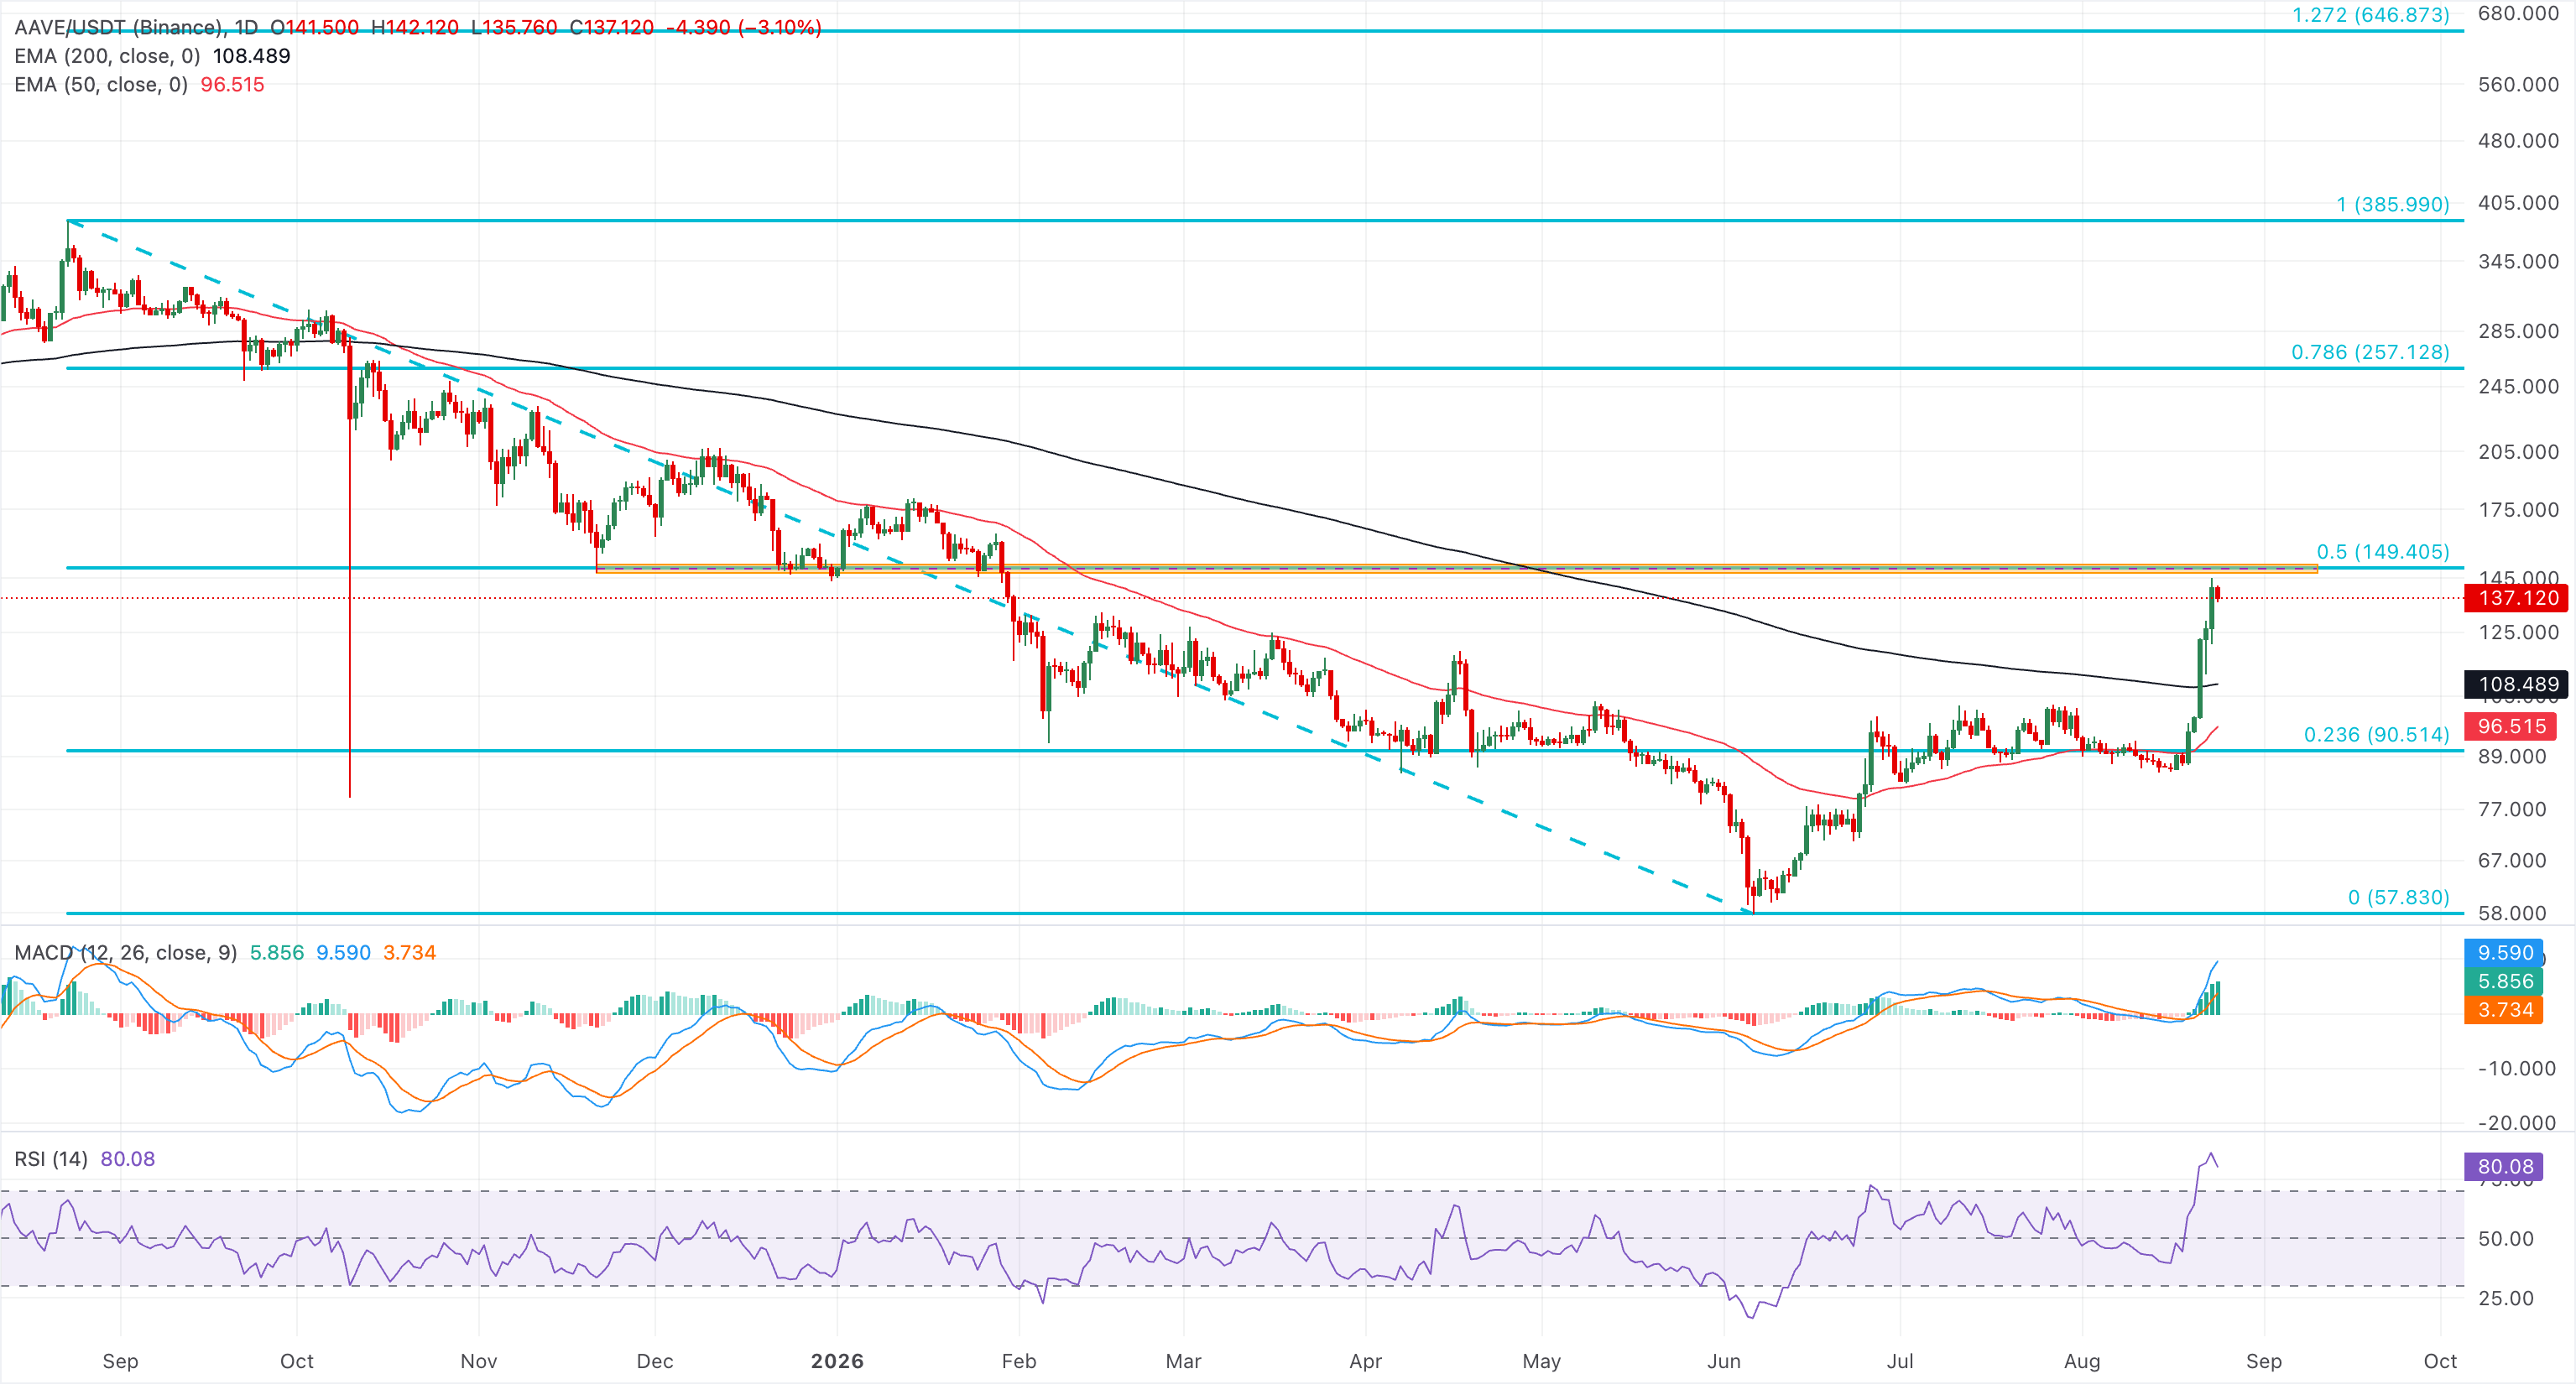
Looking down, immediate support is located at the 200-day EMA at $108.49 and the 50-day EMA at $96.51, levels that would be expected to attract dip-buying if a corrective pullback unfolds.
(The technical analysis of this story was written with the help of an AI tool. Know more.)
Recommended Articles


