


Ethereum Price Forecast: Bulls defend rally above $2,300 despite rising profit-taking
Ethereum price today: $2,320
- Short traders are opening new positions, and profit-taking is rising following large exchange inflows.
- Bulls are defending the rally as whale accumulation rises and exchange outflows increase.
- ETH is targeting the $2,431 resistance after its recent rally.
Ethereum (ETH) continued its rally on Thursday as capital gradually flowed back into the derivatives market after the recent leverage flush.
ETH open interest, which is the total worth of outstanding contracts in a derivatives market, has risen by 270K ETH to 13.2M ETH over the past few hours. Funding rates also spiked to 0.011%, their highest level since late May, indicating more longs are betting on a continuation of the upside.
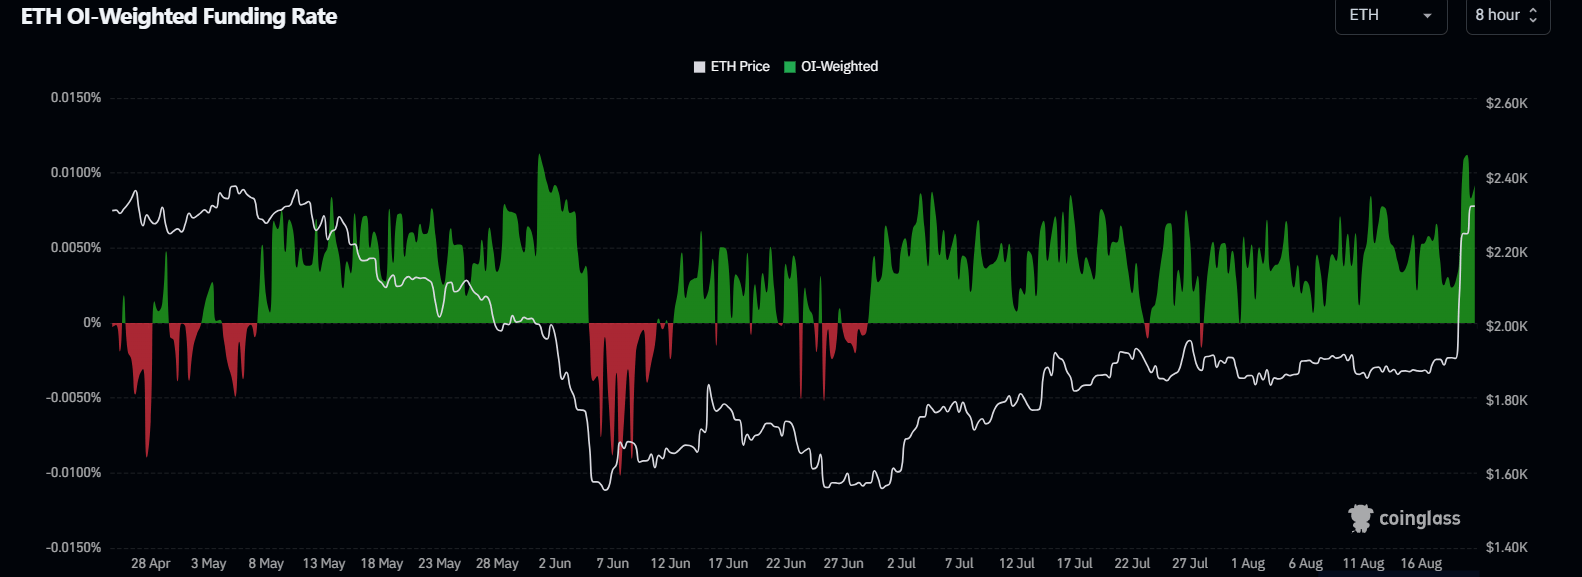
The move comes as the crypto market recorded its largest short liquidations in history on Wednesday, worth roughly $3 billion. ETH short liquidations represented about 40% of that figure. Following the wipeout of short positions, Ethereum's open interest dropped to 12.93 million ETH, its lowest level since March 8, before the modest recovery.
A few whales have begun opening short positions in anticipation of a potential correction following the squeeze, according to Lookonchain data. Wallets 0x004e and 0x2E88 opened 20K and 9.3K ETH short positions, respectively.
Others are booking profits by distributing tokens through centralized exchanges. The move is evident in the Exchange Inflow, which shows two recent key spikes, indicating investors are moving coins from private wallets to exchanges to book profits as ETH has posted a 20% gain since Wednesday.
 - All Exchanges (2)-1787260656129.png)
On the other end of the spectrum, whales are defending the rally, with fresh accumulation. Whale wallets 0x2d59, Abraxas Capital, and newly created wallet 0x2261 withdrew 30K, 18K and 6.7K ETH from Binance, respectively.
The Exchange Outflow metric has also surged higher, showing rising buying pressure to counter the selling.
 - All Exchanges-1787260734704.png)
Exchange-traded fund (ETF) investors also supported the rally as US spot ETH ETFs pulled in $189.1 million on Wednesday, their largest single-day inflow since last October, per SoSoValue data.
Ethereum Price Forecast: ETH eyes $2,431 resistance after recent price jump
On the daily chart, ETH is extending a strong bullish phase above its key Exponential Moving Averages (EMAs). Price holds well above the 200-, 100-, 50- and 20-day EMAs at $2,177, $1,932, $1,961 and $1,902, reinforcing a supportive backdrop.
Momentum is stretched, with the 14-day Relative Strength Index (RSI) at 84 and the Stochastic Oscillator (Stoch) at 92, hinting at overbought conditions that could slow the advance without yet signaling a clear reversal.
On the topside, immediate resistance is seen at the horizontal barrier near $2,431, where a clear break would open the way to further gains.
On the downside, initial support sits around the 200-day EMA and the nearby horizontal level at $2,172, forming a first demand cluster. A deeper pullback would find additional support around the 20-day EMA and horizontal line at $1,961, followed by the 100- and 50-day EMAs, before stronger structural floors at $1,809, $1,701 and $1,507.
(The technical analysis of this story was written with the help of an AI tool. Know more.)
Recommended Articles


