


Citigroup Stock Forecast: Regulatory Exit Could Unlock Growth as C Eyes $136
TradingKey - Citigroup (NYSE: C) closed at $131.92 on October 12, a gain of 1.76% on the day. The movement may have been related to the upcoming release of Citi’s third quarter earnings as well as anticipation of a notable decision from a regulator. Reuters reported Citi is looking for resolution of U.S. consent orders after a number of years of substantial spending on remediation.
Citi has set its third quarter earnings release for 8:00 a.m. E.T. on October 13 and its investor call for 11:00 a.m. E.T. The following analysis is based on information available prior to the release. The big question is, will falling costs and improving returns outlast the restructuring charges?
Regulatory Cleanup Could Unlock Growth
On October 12, Reuters disclosed Citi is working toward resolution of the orders from the Federal Reserve and the OCC from 2020. Citi has spent roughly $3.3 billion on control, risk management and data improvements. Citi CEO Jane Fraser indicated they have roughly 90% of the remediation work complete.
What’s of interest is the potential for Citi to shift resources to growth as a result of removing the orders. Investors should be mindful that regulatory remediation is not the same as obtaining regulatory relief. Therefore, while it may be prudent to consider the orders as a potential catalyst, the market should not get ahead of itself.
Q2 Earnings Established Strong Momentum
Citi reported a 14% increase in revenue to $24.8 billion for the second quarter, while net income rose 45% to $5.8 billion. Diluted EPS was $3.15 and return on tangible common equity (RoTCE) improved to 13.0%. Management called this their best quarterly revenue in a decade.
This quarter's revenue is positive, but does not reflect reliable returns. We will have to wait to see if improvement in expense control and discipline returns in the third quarter.
Services and Digital Payments Differentiate Citi
Services is Citi’s international payments and custody and liquidity management business and was the best quarter ever. Services is a key differentiator for Citi in international markets due to its relational business nature.
Citi also announced on September 29th the launch of instant payments through Swift’s Payments Scheme, to cover GBP, AUD, USD, and INR. Additionally, Citi Token Services expanded to Japan and the UAE. Long-term profitability is unknown, but the launches strengthen the business.
Markets and Banking Face Tough Comparisons
Equities reported a 45% revenue increase and Banking, 34%. Reuters reported the six largest U.S. banks made an estimated $51 billion in trading revenue in the second quarter, and expected third quarter revenue growth to moderate. Strength in trading can be cyclical and short term, rather than structural.
Treasury yields are increasing and so may the cost of funding and decrease in trading activities. I prefer more balance in the results among Services, Markets and Banking, rather than results primarily from trading activities.
Higher RoTCE and Buybacks Support the Thesis
Citi's September announcement of slightly improved 2026 RoTCE of slightly above 11% was also reported by the CFO, Gonzalo Luchetti. Luchetti also expected repurchases to be above the $13 billion bought back during 2025. They are directional views and not actual results.
Citi spent about $5 billion in dividends and repurchases during Q2 with a CET1 ratio of 12.8% and Tangible Book Value of $100.89 per share. The stock price was $131.92 at time of writing, which was roughly 1.31x Tangible Book Value for Q2 2026, indicating more weight on Citi's sustained profitability going forward.
Expenses and Banamex Still Present Risks
Acceleration of approximately $500 million in spending through year-end, including severance and marketing in Cards and Wealth, was discussed by Luchetti. As mentioned previously, Durable expense efficiency is crucial to the turnaround.
Banamex is expected to leave Citi's balance sheet in 2027. This is likely to result in a $9 billion loss from currency translation adjustment. The currency translation adjustment would be recognized in Citi’s reported earnings when applicable, impacting EPS and RoTCE, rather than being a recurring banking operating expense.
Citigroup Technical Analysis: C Needs $136 Recovery Confirmation
The past week has seen C trade between $124.10 and $132.00. The rebound from the October 7 low of $124.10 and October 9 close of $129.64 suggests the development of short-term demand. Expect $132.00 to create initial resistance. This is followed by the September 25 close of $134.28 and the $135- $136 recovery zone, as a potential recovery zone.
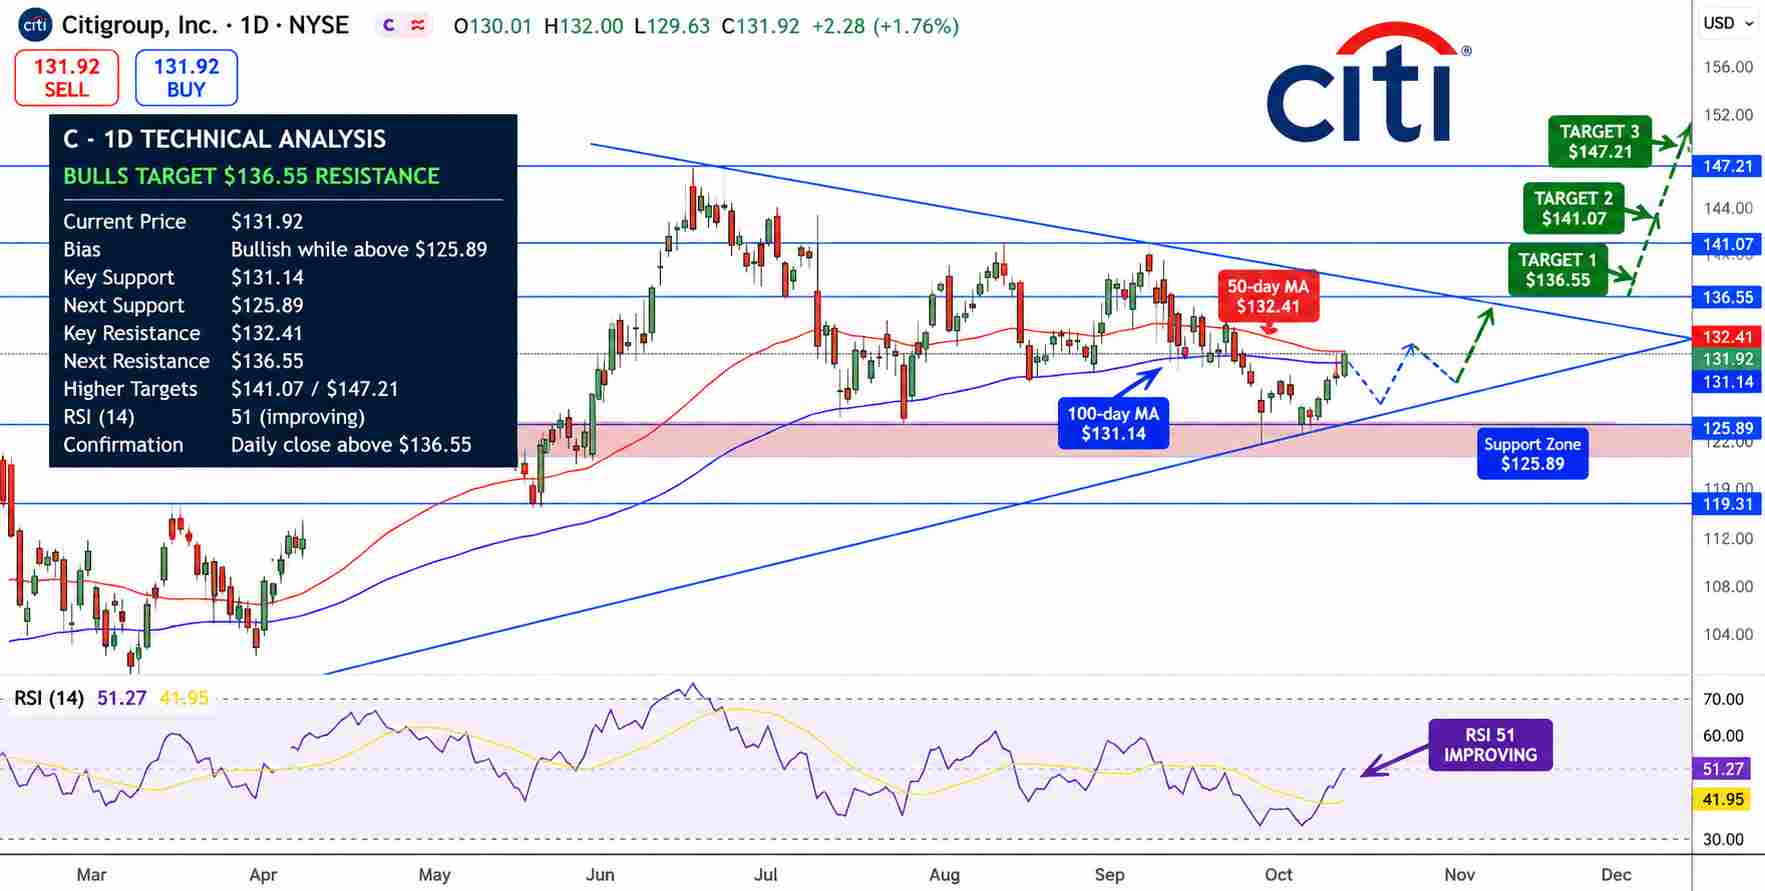
Citigroup Stock Price Chart - Source: Tradingview
The supplied chart shows a symmetrical triangle with the RSI at 51. The moving averages are at about $132.41 and $131.14. Other indicators cannot be confirmed on the dated charts provided. Without a matching dated chart, a claimed break of the long-term rising trendline and weak momentum cannot be independently confirmed.
I have a bullish bias above $129.64. The 135-136 area should create resistance, along with the September 25 close of $134.28. A closing price below $129.64 would re-establish the $125.35 and 124-125.50 areas as potential support. Earnings may negate any potential support and resistance levels.
Key Levels
Latest closed price: $131.92 on October 12
Support: $129.64, $125.35, $124- $125.50
Resistance: $132.00, $135-$136
RSI: about 51 on supplied chart; independently unverified
Recovery Zone: closed above $132, then $136
Breakdown Zone: loss of $129.64
FAQ: Why Is Citigroup Stock in Focus?
Q3 earnings coupled with reported progress on resolving long-term regulatory orders creates a potential catalyst for Citi’s turnaround.
FAQ: What Is Citi's Main Breakout Level?
The October 12 intraday high for Citi is $132. A clear move over this level would be positive and confirm a bullish bias, however, further confirmation over $135-136 would support an even stronger bias.
Bottom Line
For the time being stronger moves, along with possible regulatory relief, tip the longer-term outlook toward positive. From a valuation standpoint, Citi is still over-extended. A confirmed break above $135-136 would be required to call the broader correction over.
Recommended Articles


