


Crypto Overview: Bitcoin loses $64,000 – LINK, DOGE sustain gains
- Bitcoin takes support at a rising trendline near $63,676 on Wednesday after breaking below the 50-day EMA at $64,583.
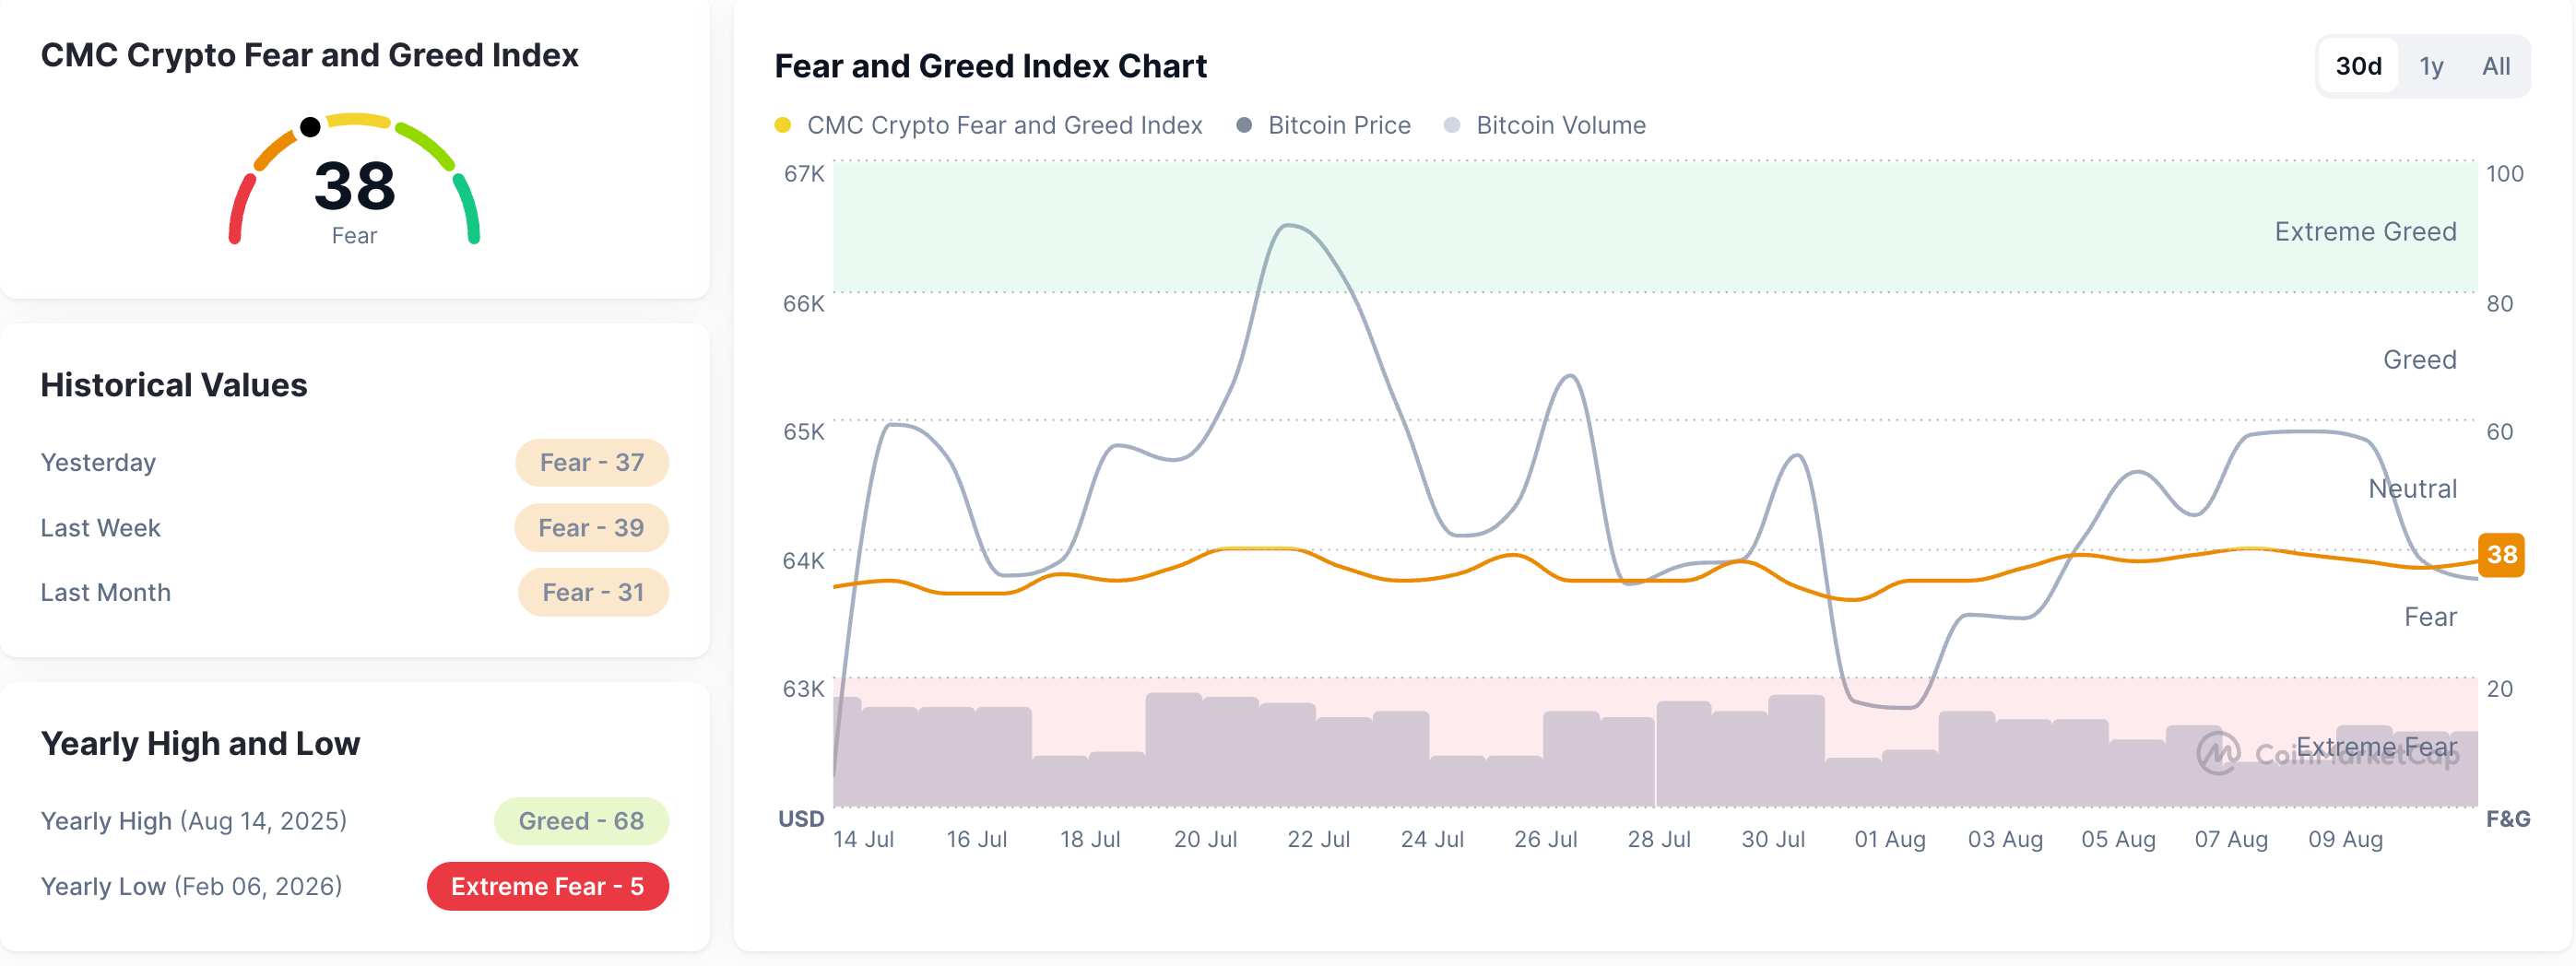
- Market sentiment remains risk-averse, with the Fear and Greed Index at 38, below the neutral zone.
- Chainlink and Dogecoin hold gains over the last 24 hours, emerging as the best performers in the near term.
Bitcoin is trading below $64,000 at press time on Wednesday amid a broader market risk-off sentiment. Emerging as top performers over the last 24 hours, Chainlink (LINK) and Dogecoin (DOGE) sustain gains, hinting at an extended recovery.
CoinMarketCap’s Fear and Greed Index at 38 reflects persistent risk-averse sentiment in the crypto market.
Technical outlook: Will Bitcoin extend losses?
Bitcoin maintains a bearish near-term tone as the price remains below the 50-day Exponential Moving Average (EMA) at $64,583, with the 100-day and 200-day EMAs at $66,736 and $72,190, respectively, suggesting the broader trend remains under pressure.
From a technical perspective, BTC is trading marginally above the short-term rising support trendline at $63,676. A decisive close below this level could extend the decline toward the July 6 low at $61,307.
Momentum remains subdued, with the Relative Strength Index (RSI) hovering near a neutral 48 and the Moving Average Convergence Divergence (MACD) slipping slightly below the signal line, hinting that buying interest lacks conviction.
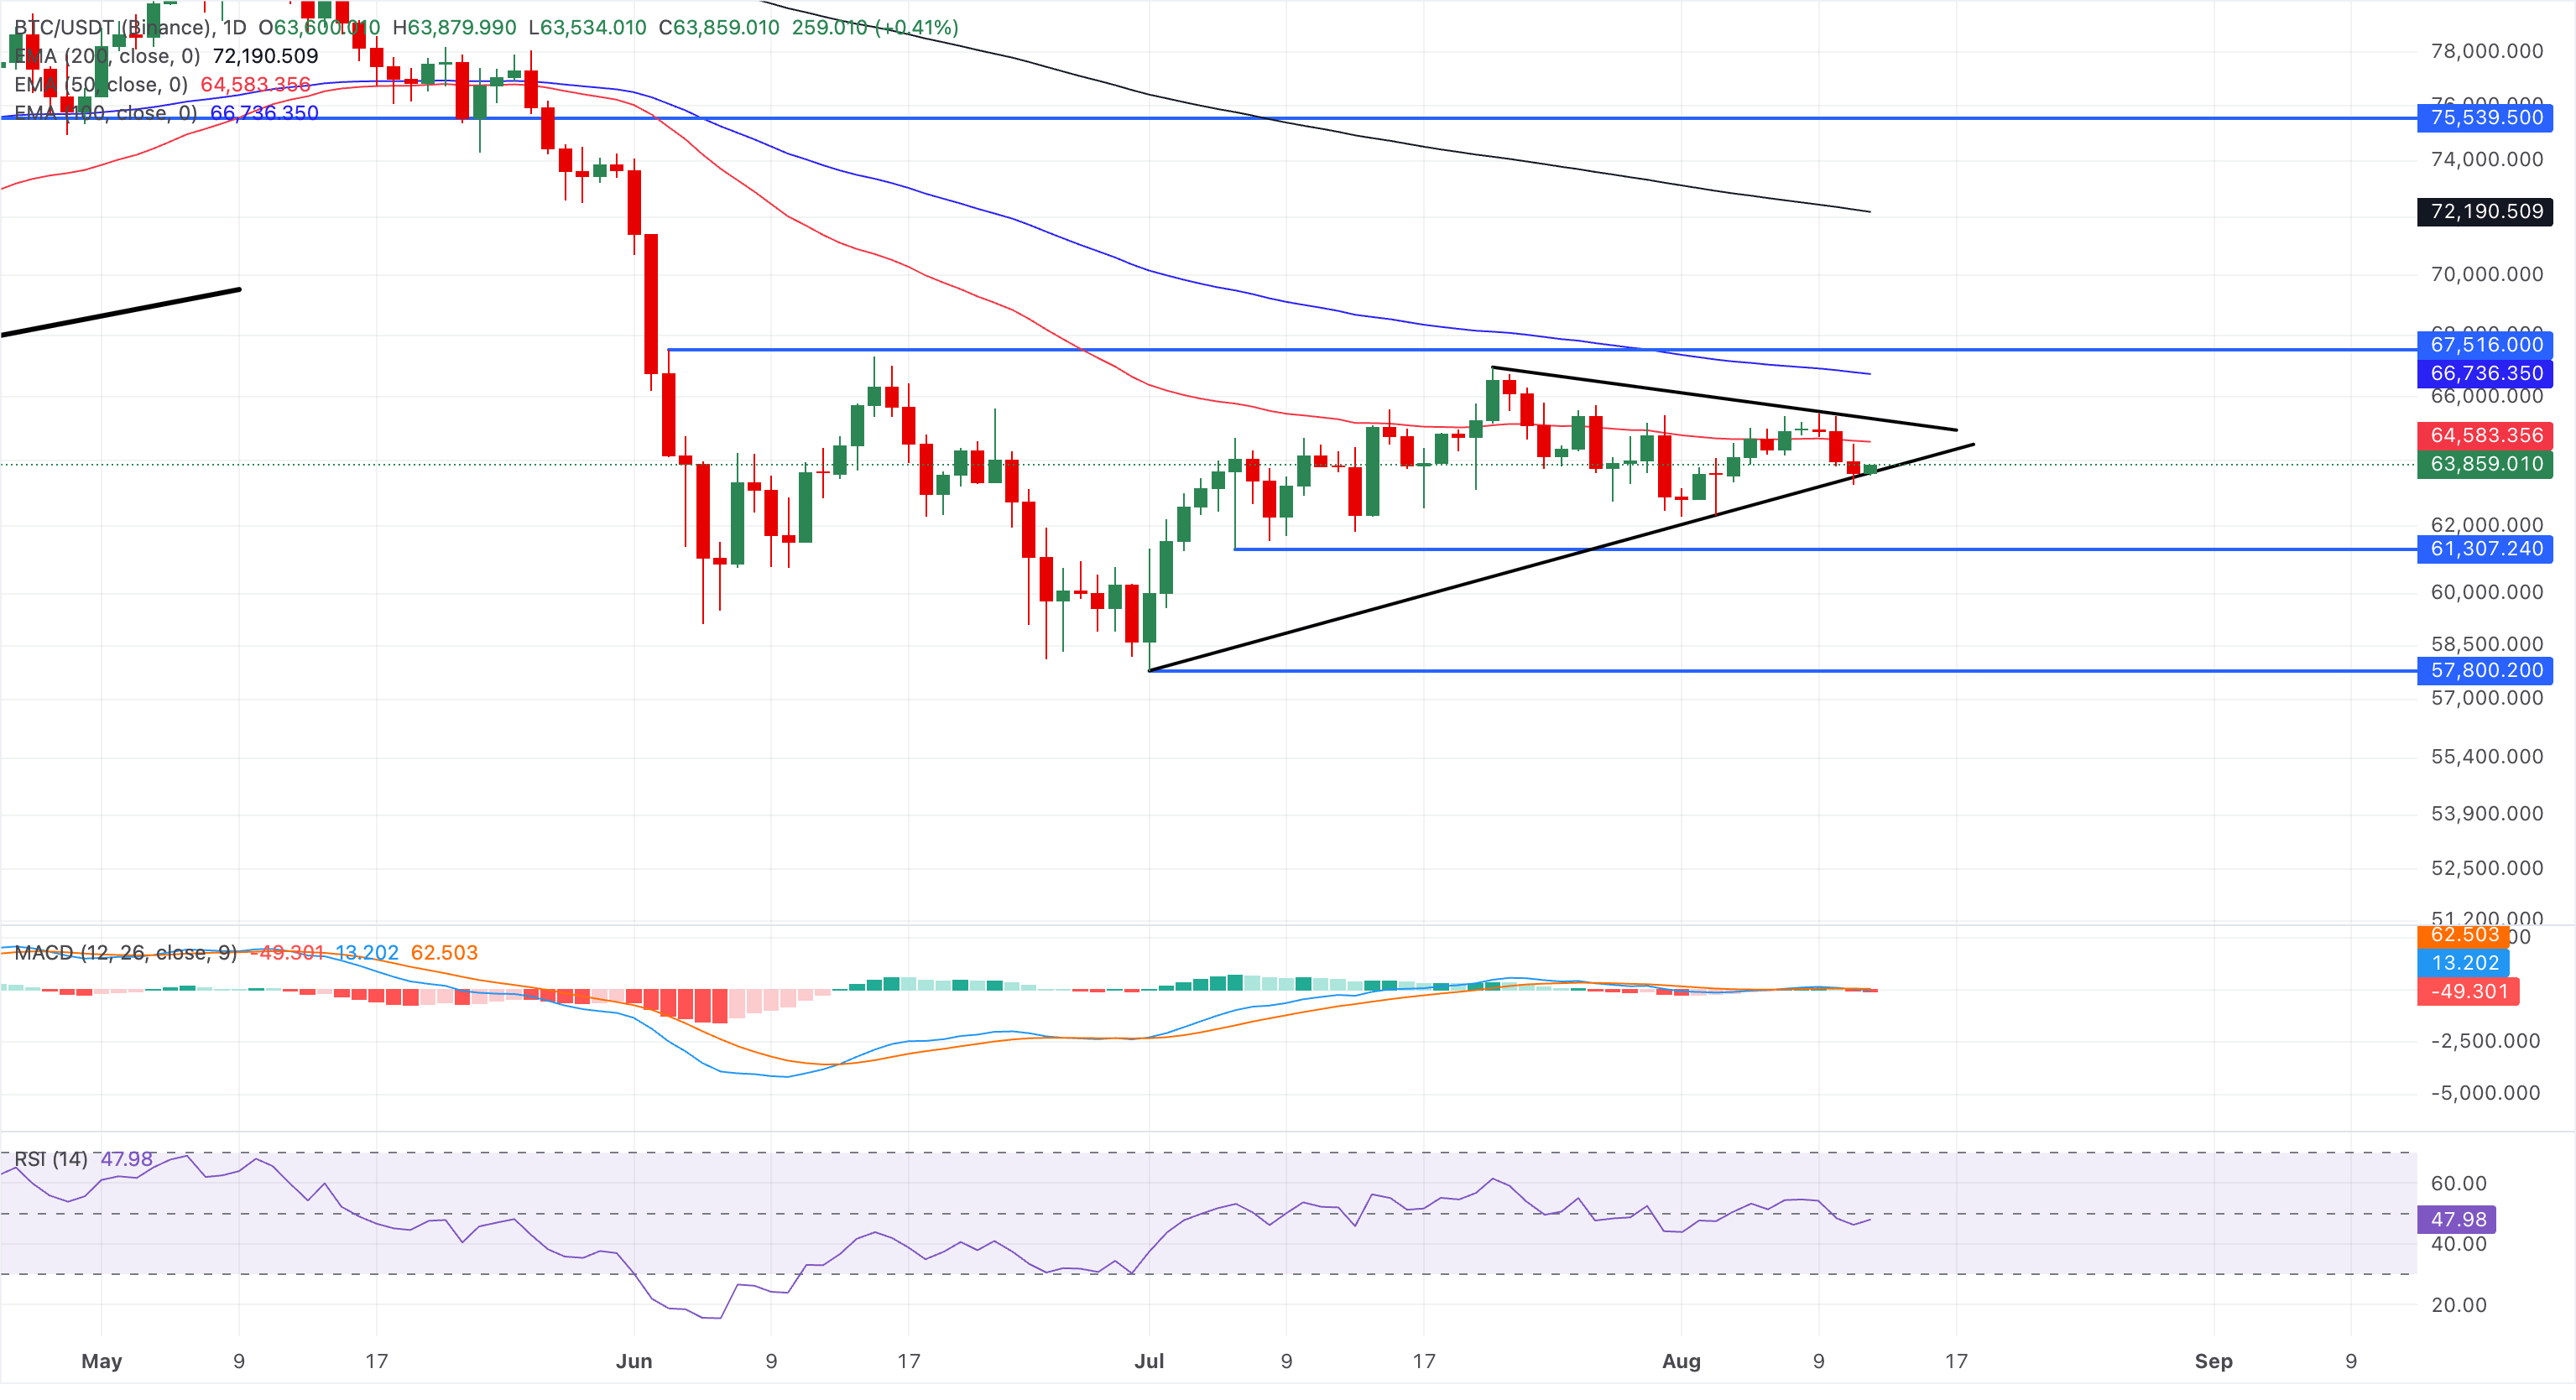
On the topside, immediate resistance is seen at the 50-day EMA near $64,583, followed by the descending trendline around $65,312, which caps the recent recovery attempts.
Technical outlook: Could Chainlink and Dogecoin extend gains despite broader market pressure?
Chainlink holds steady above $8.75 on Wednesday, following a roughly 6% surge the previous day. LINK maintains a bullish near-term bias as price holds above the 50-day and 100-day EMAs at $8.2944 and $8.5304, respectively, while the 200-day EMA at $9.9622 sits overhead, capping the broader recovery.
Momentum supports the constructive tone, with the RSI around 62, bouncing off the midline, while the MACD holds above the signal with a bullish histogram expanding, suggesting strengthening upside pressure.
From a technical perspective, LINK holds above the 50% retracement of the downswing from $10.8700 to $6.9960, at $8.7204. If LINK advances recovery above this zone, it could target the 78.6% Fibonacci retracement level at $9.8917, reinforced by the 200-day EMA at $9.9622.
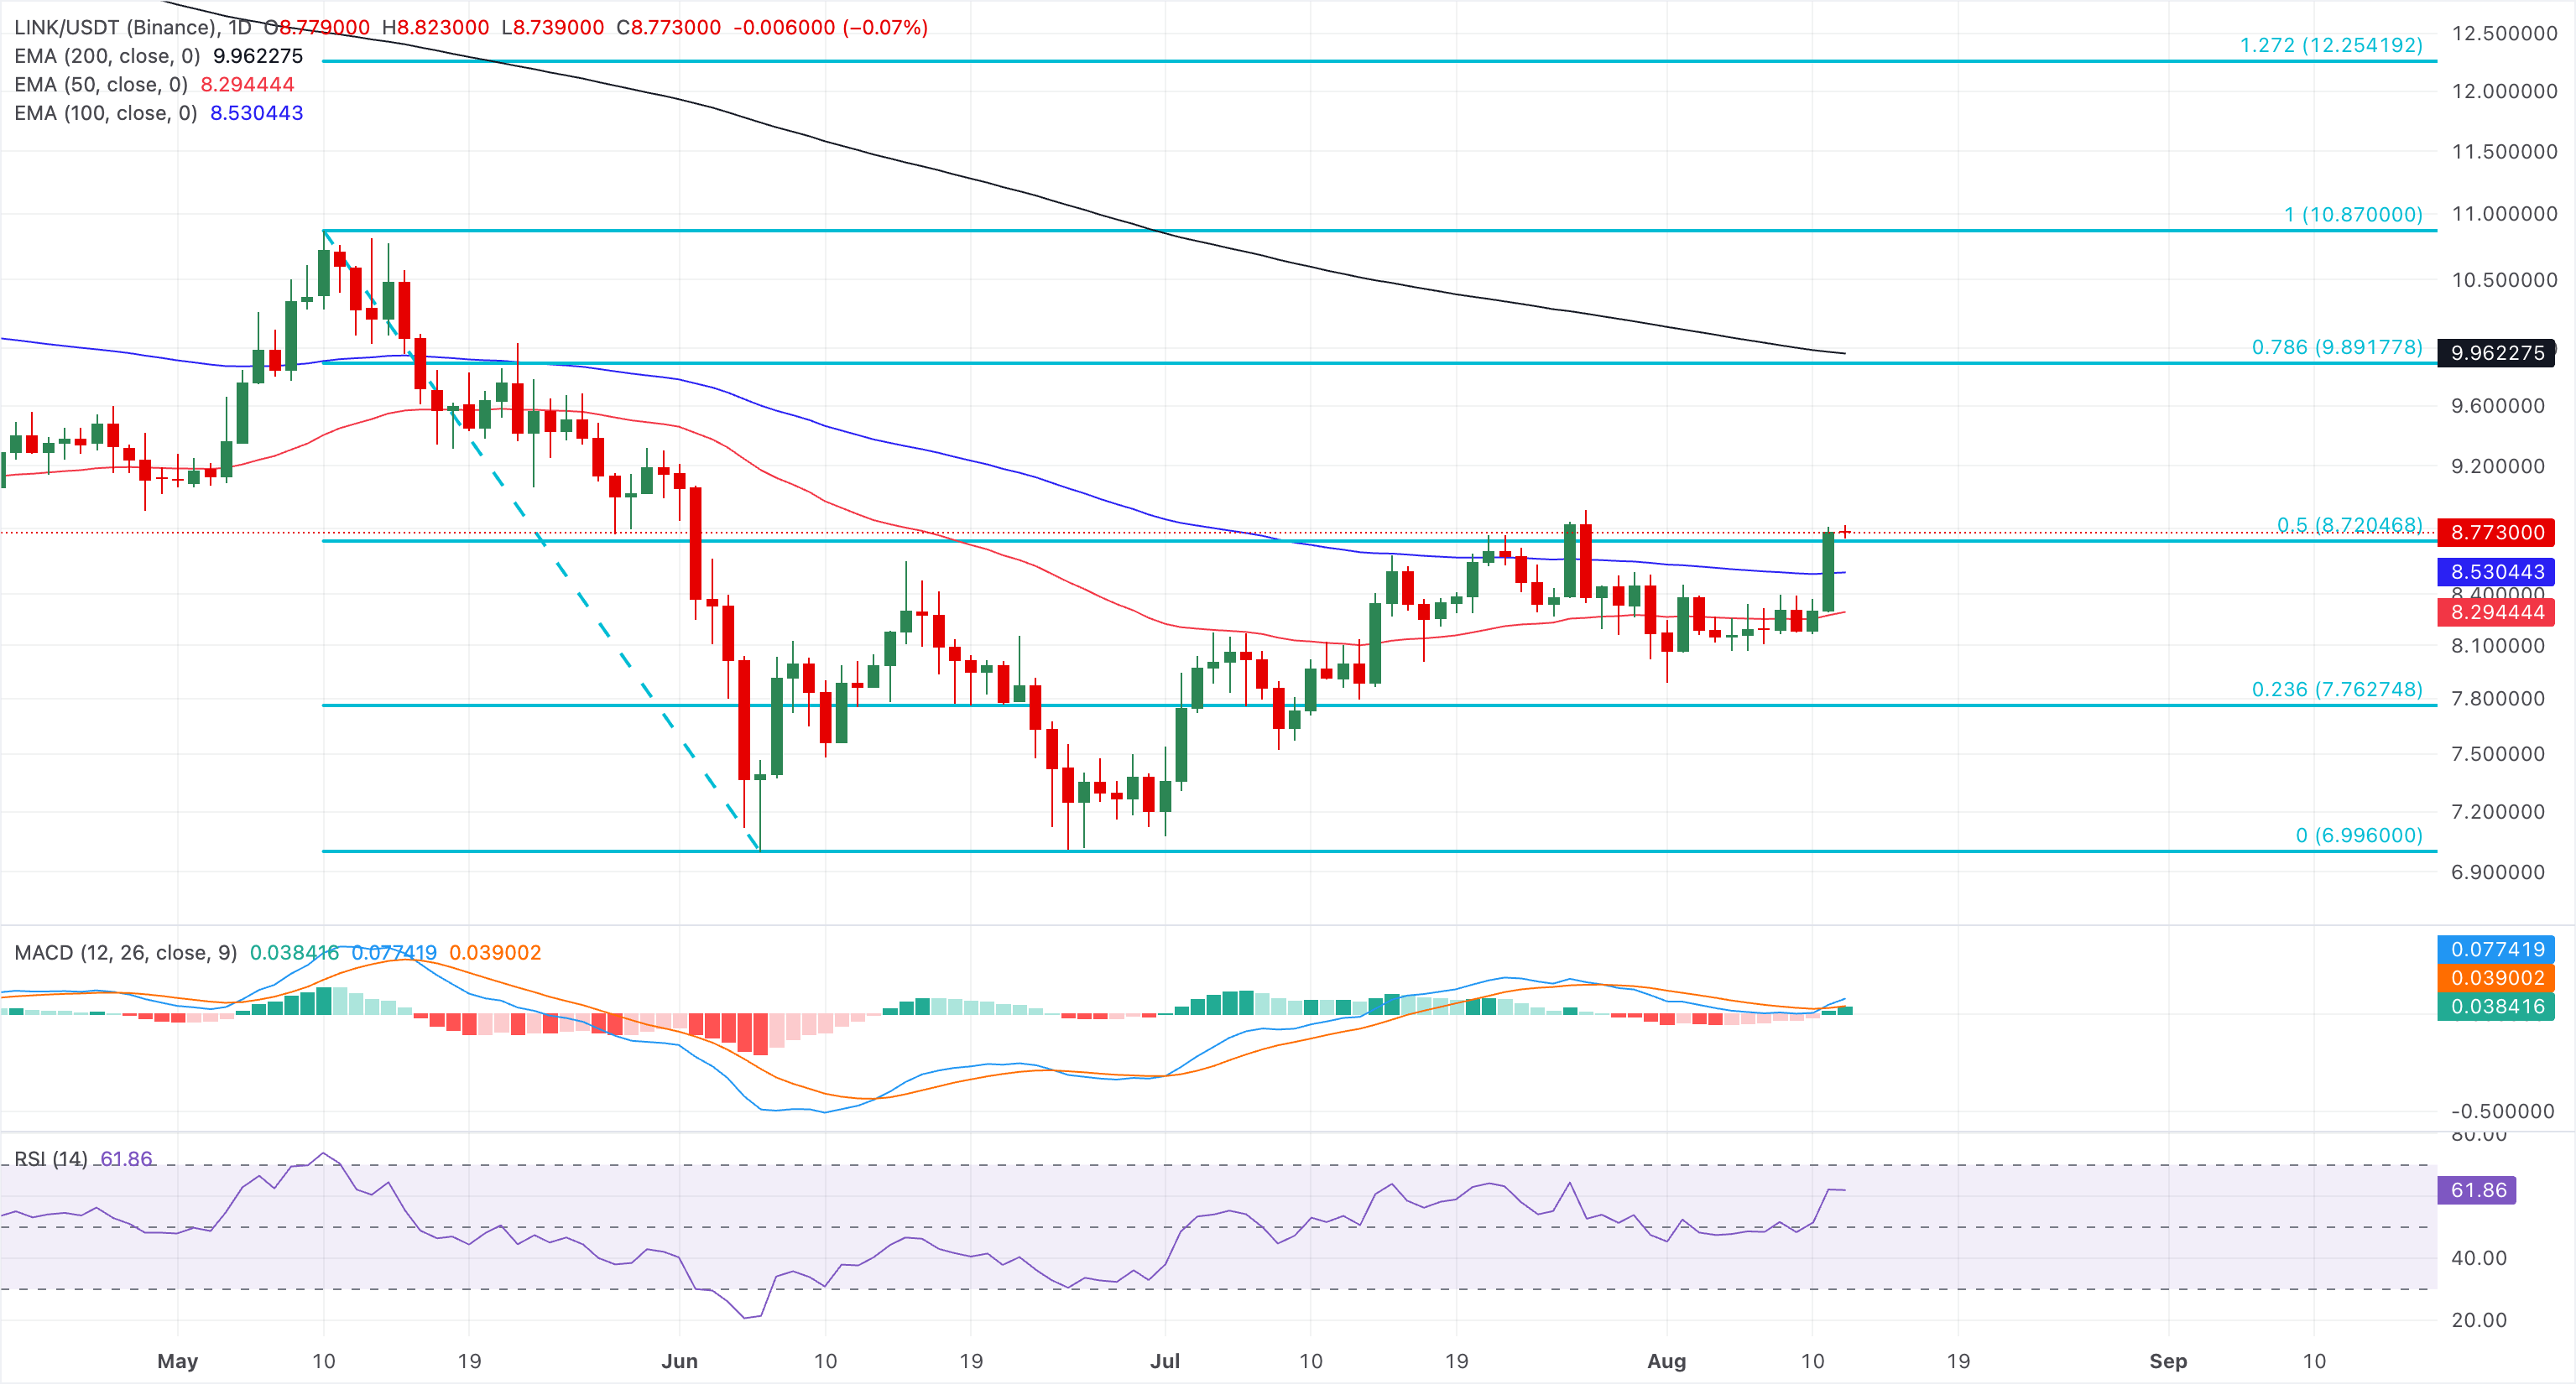
On the downside, initial support is seen at the 100-day EMA at $8.5304, backed by the 50-day EMA at $8.2944 ahead of the 23.6% retracement at $7.7627.
Dogecoin trades above $0.0700 at press time on Wednesday, sustaining its mild 3% rise from the previous day. DOGE maintains a bearish near-term tone as the price remains below the 50-day EMA at $0.0743 as the first cap, with the 100-day EMA at $0.0815 and the 200-day EMA at $0.0970 reinforcing a broader downside bias.
The RSI around 53 suggests modestly positive but not overextended momentum, while the MACD holds marginally above the signal line, which hints at upside stabilization.
On the downside, initial support emerges at the July 24 low at $0.0682, followed by the downward support trendline near $0.0668, where buyers would need to defend to avoid a deeper slide toward previous lows.
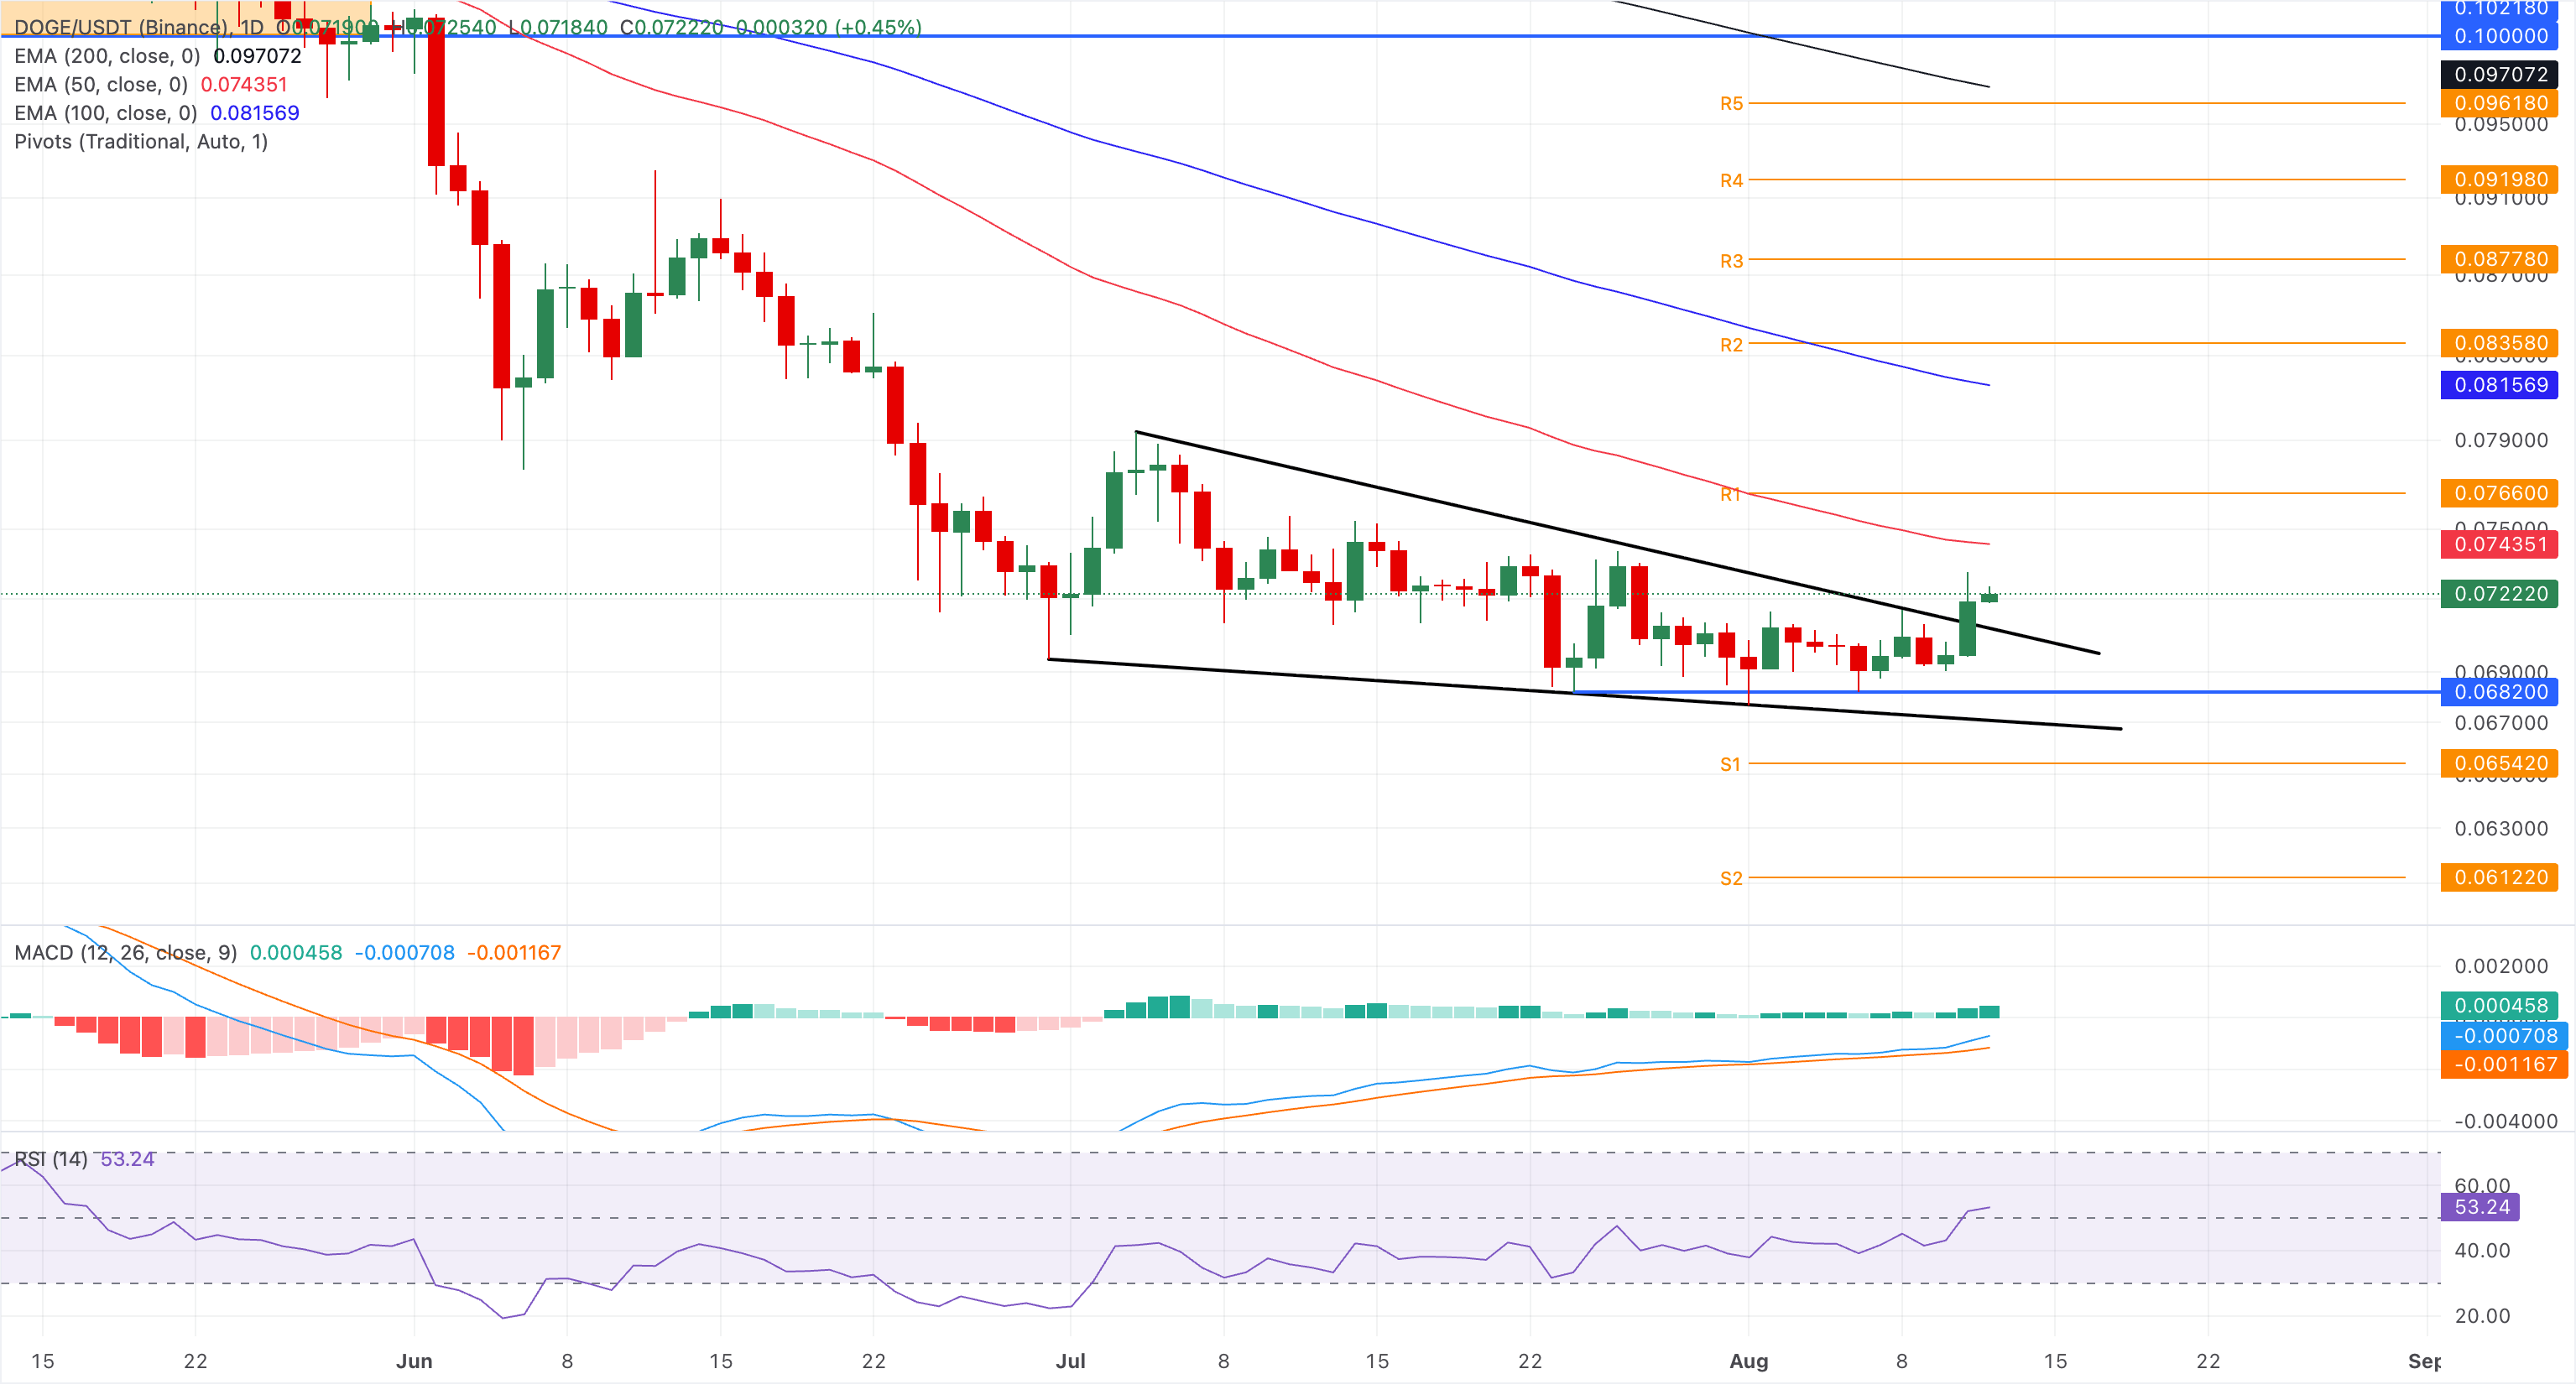
On the topside, immediate resistance is located at the 50-day EMA at $0.0743, followed by the 100-day EMA at $0.0815.
(The technical analysis of this story was written with the help of an AI tool. Know more.)
Recommended Articles


