


For the Second Time in History, the Stock Market Sends a Rare Warning Signal and Points to Looming Trouble Ahead
Key Points
The S&P 500 looks strong on the surface, but underneath, there are several weaknesses.
Historically, this is one of the most expensive markets, which could mean a downturn is just around the corner.
Bear markets are a part of investing, and the best thing to do is to endure them with a long-term perspective.
- 10 stocks we like better than S&P 500 Index ›
The S&P 500 (SNPINDEX: ^GSPC) has been indomitably bullish for four years. Nothing has successfully slowed down this bull market: tariffs, a war, or even an interest rate hike. And yet, below the surface, warning signs are sounding from every corner.
Earlier this month, analysts at MarketWatch astutely observed that 44% of S&P 500 stocks were in bear-market territory. In other words, more than two-fifths of the S&P 500's stocks were trading at least 20% below their 52-week high. Around 24% were down at least 30%, 8% of the index was below 40%, and 3% were down a whopping 50%.
Missed Nvidia in 2009? This Rare Signal Is Flashing Again. In 2009, a "Double Down" signal flashed for a little-known chipmaker called Nvidia. For the first time in years, that same "Total Conviction" signal is flashing for a company 1/100th the size of Nvidia. Continue »
The S&P 500, in other words, may look healthy and strong as an index, yet nearly half of its companies are struggling individually. Put differently, the market's impressive performance is masking its weaknesses, with only a handful of stocks truly driving the rally.
This observation coincides with a valuation signal, one that has been uncannily flashing now for at least five consecutive months.
Image source: Getty Images.
Beneath the bull market's spectacular run, a warning from history
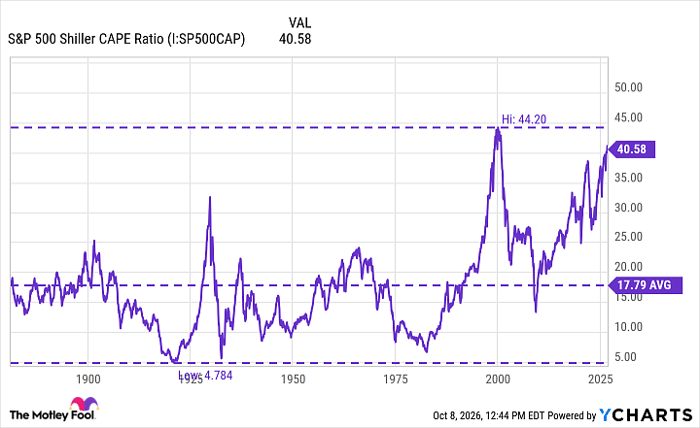
The Shiller price-to-earnings (P/E) ratio, also known as the cyclically adjusted P/E ratio (CAPE ratio), is a valuation tool that helps us determine if stocks are expensive or cheap relative to their earnings.
Higher CAPE ratios mean the market is expensive by historical standards, while lower ones mean the opposite. The average CAPE over the last 155 years is about 18. Today, the CAPE has crossed the 40-figure line for only the second time in history.
Data by YCharts
The CAPE doesn't predict market crashes; it's just a valuation metric. At the same time, it offers a pretty clear warning: When stocks become extraordinarily expensive, they tend not to stay that way for long. The last time the S&P 500's CAPE ratio climbed above 40 (in 1999), a devastating bear market followed.
History has a reassuring message
Stock market crashes take on mythical dimensions: They can feel apocalyptic. Even bull markets can feel invincible in the moment, as though nothing could bring them to an end. But they do: No bear or bull market has ever lasted forever.
Here's the thing: Bear markets, market corrections, and crashes are all normal parts of investing in the stock market. Since 1990, the S&P 500 has experienced at least 17 corrections and bear-market downturns, according to historical data from Charles Schwab. Some were relatively mild; others, like the dot-com crash, erased nearly half the index's value. But like every other bear market in the history of the stock market, they eventually came to an end.
If the CAPE ratio signals the approach of another bear market, it's best to keep a long-term perspective. Trying to predict when stocks will fall -- or when they'll rebound -- is a losing game. But buying high-quality companies and holding them through ups and downs has historically been a winning strategy for most investors.
Should you buy stock in S&P 500 Index right now?
Before you buy stock in S&P 500 Index, consider this:
The Motley Fool Stock Advisor analyst team just identified what they believe are the 10 best stocks for investors to buy now… and S&P 500 Index wasn’t one of them. The 10 stocks that made the cut could produce monster returns in the coming years.
Consider when Netflix made this list on December 17, 2004... if you invested $1,000 at the time of our recommendation, you’d have $379,123!* Or when Nvidia made this list on April 15, 2005... if you invested $1,000 at the time of our recommendation, you’d have $1,408,822!*
Now, it’s worth noting Stock Advisor’s total average return is 950% — a market-crushing outperformance compared to 215% for the S&P 500. Don't miss the latest top 10 list, available with Stock Advisor, and join an investing community built by individual investors for individual investors.
See the 10 stocks »
*Stock Advisor returns as of October 13, 2026.
Charles Schwab is an advertising partner of Motley Fool Money. Steven Porrello has no position in any of the stocks mentioned. The Motley Fool recommends Charles Schwab and recommends the following options: short September 2026 $95 calls on Charles Schwab. The Motley Fool has a disclosure policy.
Recommended Articles


