

BNB Price Forecast: Tests $602 resistance as bullish momentum builds

Source Fxstreet
  • BNB price extends its gains toward the 100-day EMA at $602.69, with a close above this key level potentially opening the door to further upside.
  • Derivatives metrics back a bullish bias, with rising open interest, increasing bullish bets and positive funding rates.
  • The technical outlook supports further gains as momentum strengthens and the broader bias remains bullish.

BNB (BNB), formerly known as Binance Coin, extends its gains, trading above $598 on Wednesday and approaching the key resistance zone. A decisive close above this barrier could strengthen the bullish outlook. Meanwhile, the derivatives data and momentum indicators also support further upside for BNB.

Derivatives data supports a bullish bias

Derivatives data shows bullish sentiment among BNB traders. CoinGlass’ long-to-short ratio for BNB reads 1.14 on Wednesday, the highest level over a month. A ratio above one indicates bullish sentiment, as traders are betting the asset price will rise.
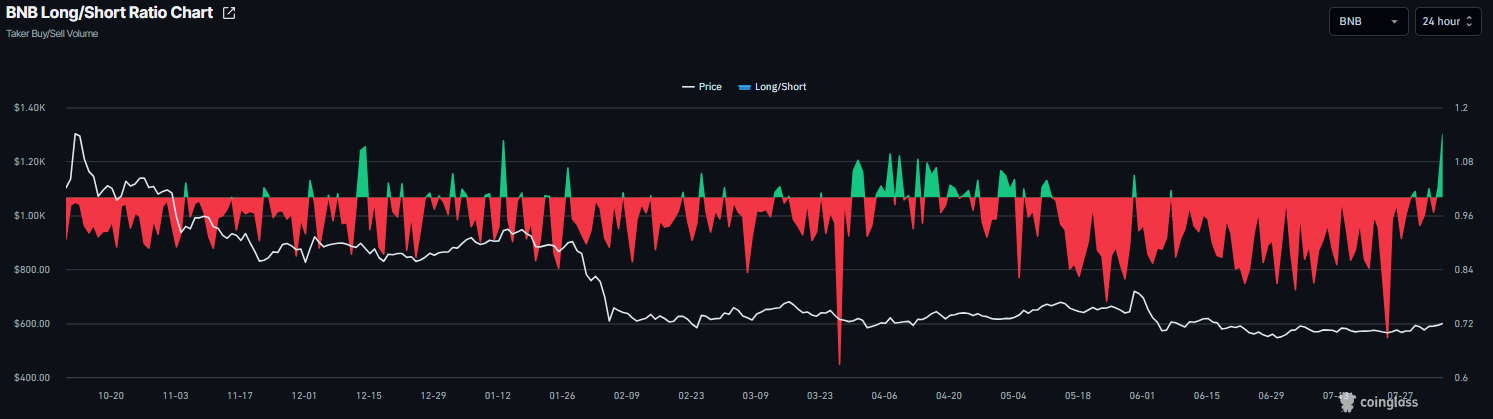
BNB long-to-short ratio chart. Source:Coinglass

In addition, CoinGlass’ Open Interest (OI) across exchanges chart for BNB has been surging since July 30, with outstanding contracts reaching 1.64 million BNB coins on Wednesday. The increase in OI alongside rising prices suggests that new long positions are entering the market, signaling a bullish outlook and raising the potential for further upside in BNB.
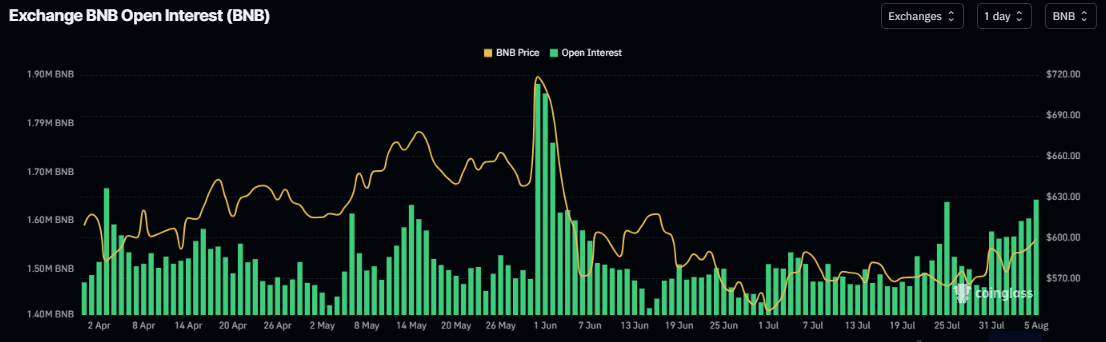
BNB open interest chart. Source: Coinglass

CoinGlass’ funding rates metric for BNB flipped positive on July 12, reading 0.0059% on Tuesday. These positive rates indicate that long traders are paying shorts and reflect a bullish bias.
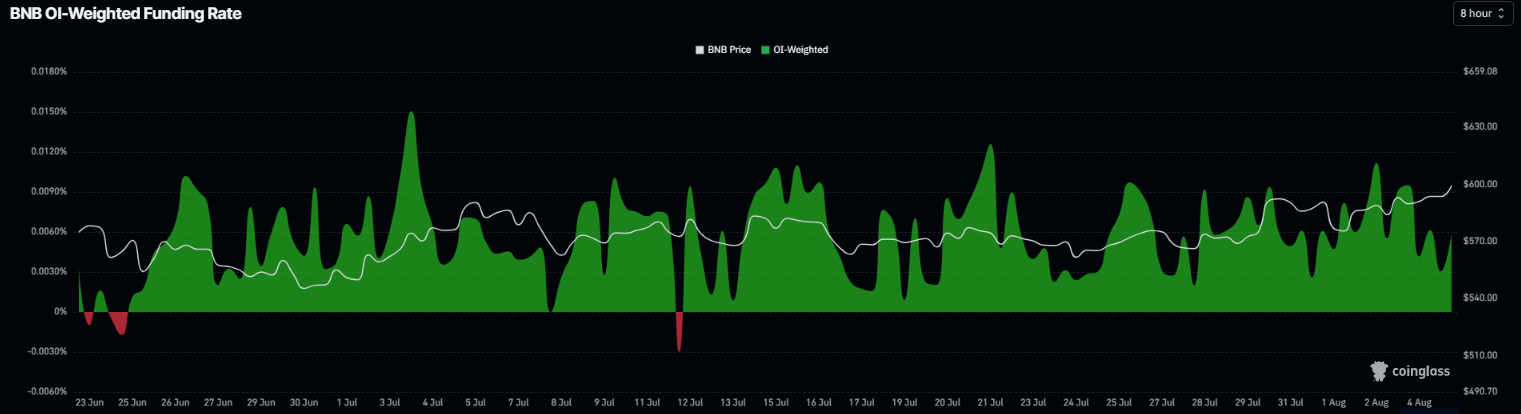
BNB funding rates chart. Source: Coinglass

BNB technical outlook: Extends gains

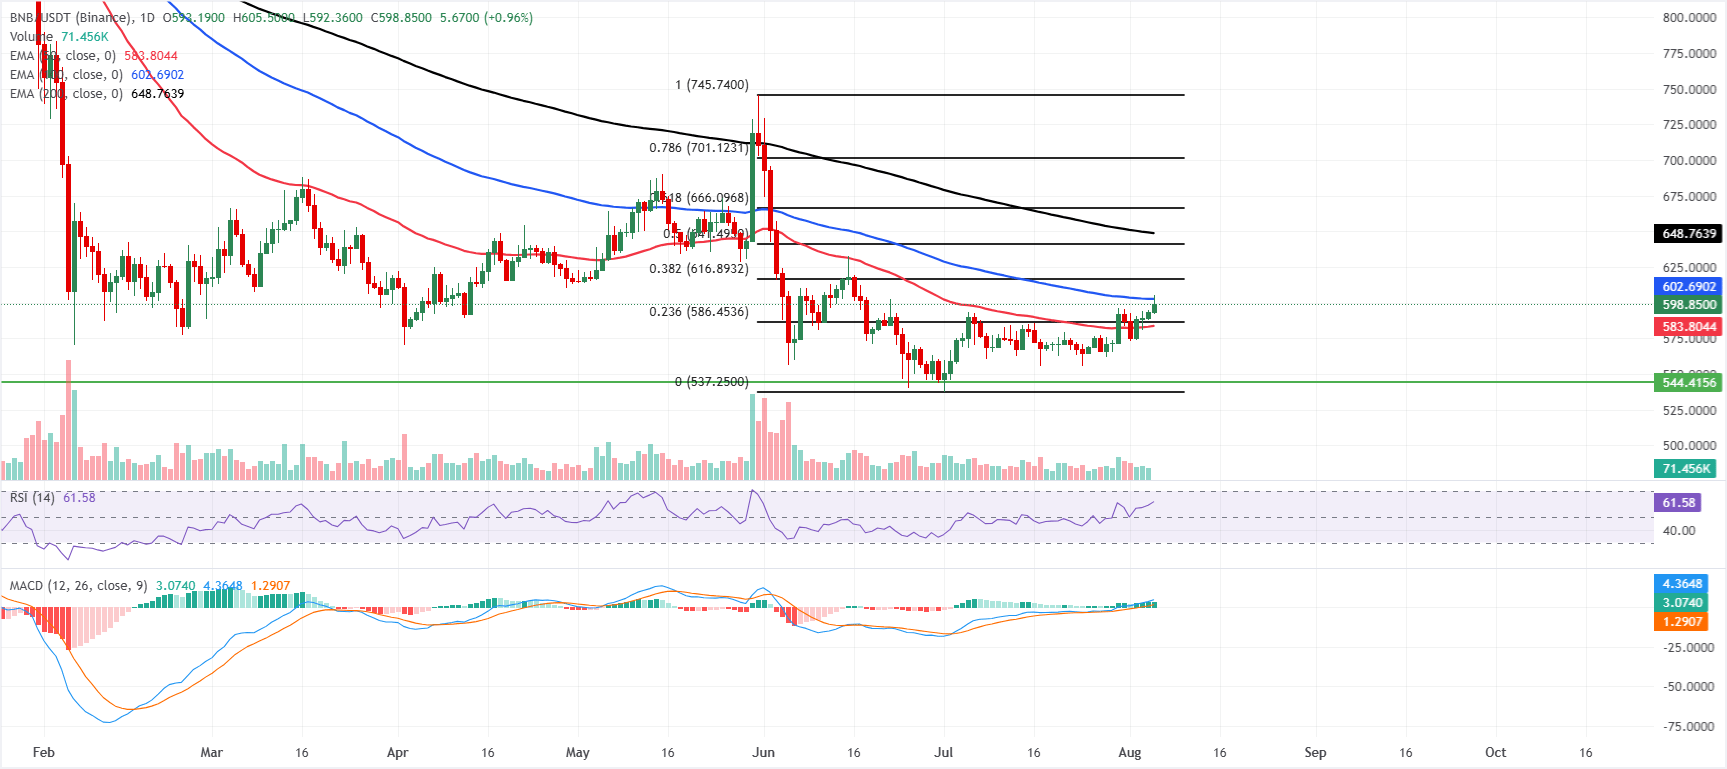
BNB price trades at $598 on Wednesday, extending gains for the fourth consecutive day. The near-term bias looks constructive as price holds above the 50-day Exponential Moving Average (EMA) at $583.80 and the 23.6% Fibonacci retracement at $586.45, suggesting a developing demand zone just beneath the market. 

Momentum is supportive, with the Relative Strength Index (RSI) hovering in bullish territory near 62 and the Moving Average Convergence Divergence (MACD) line advancing further into positive ground, hinting that buyers retain the upper hand while spot trades below the cluster of medium- and long-term EMAs.

On the topside, initial resistance is seen at the 100-day EMA around $602.69, followed by the 38.2% Fibonacci retracement at $616.89 and the 50% retracement near $641.50, before a denser cap emerges from the 200-day EMA at $648.76.

On the downside, immediate support is located at the 23.6% retracement at $586.45 and the 50-day EMA at $583.80, with a deeper pullback exposing the horizontal floor at $544.41.
(The technical analysis of this story was written with the help of an AI tool. Know more.)

Disclaimer: For information purposes only. Past performance is not indicative of future results.
placeholder
Will the Tech Rally Continue? The Technical Verdict on the NASDAQ 100 Riding a massive 32% post-earnings wave, the Nasdaq-100 is showing its first signs of exhaustion. We break down crucial exit and entry rules for long positions this week.
Author  Mitrade Team
6 Month 05 Day Fri
Riding a massive 32% post-earnings wave, the Nasdaq-100 is showing its first signs of exhaustion. We break down crucial exit and entry rules for long positions this week.
placeholder
XRP Price Prediction for July 2026: Can Buyers Finally Break the Downtrend?XRP (XRP) price trades near $1.05, caught between a year-long downtrend and a sudden burst of buying.July has historically rewarded XRP holders. This year the month arrives with on-chain accumulation
Author  Beincrypto
6 Month 30 Day Tue
XRP (XRP) price trades near $1.05, caught between a year-long downtrend and a sudden burst of buying.July has historically rewarded XRP holders. This year the month arrives with on-chain accumulation
placeholder
Intel Price Forecast: Nvidia Picked Xeon 6, Invested $5B, Yet Analysts Still Trail INTCIntel Corporation (NASDAQ: INTC) sits at $140.05, holding firm on the ascending trendline within the 2H timeframe. The RSI indicator is currently reading 55.21, positioning it as neutral-
Author  TradingKey
7 Month 02 Day Thu
Intel Corporation (NASDAQ: INTC) sits at $140.05, holding firm on the ascending trendline within the 2H timeframe. The RSI indicator is currently reading 55.21, positioning it as neutral-
placeholder
NVIDIA Price Forecast: Michael Burry Shorts NVDA, but Analysts See $299On July 1, NVIDIA (NASDAQ: NVDA) sits at $198.34, failing to break above the former support level that is now serving as resistance between $198 and $205 on the 2H chart's downward blue c
Author  TradingKey
7 Month 02 Day Thu
On July 1, NVIDIA (NASDAQ: NVDA) sits at $198.34, failing to break above the former support level that is now serving as resistance between $198 and $205 on the 2H chart's downward blue c
placeholder
Brent Crude Oil Erases Entire War Premium, Falls 40% to Pre-War LevelsBrent crude oil has erased its entire war premium, sliding roughly 40% from its March peak near $120 to trade around $72.25 on Wednesday. The move returns oil to its pre-war support base.The retreat f
Author  Beincrypto
7 Month 02 Day Thu
Brent crude oil has erased its entire war premium, sliding roughly 40% from its March peak near $120 to trade around $72.25 on Wednesday. The move returns oil to its pre-war support base.The retreat f
Related Instrument
goTop
quote