


Uniswap Price Forecast: UNI tests 200-day EMA supply amid renewed retail demand
- Uniswap regains momentum as it approaches the critical 200-day EMA resistance at $3.88.
- Retail renews appetite for perpetual futures as Open Interest rises above 65 million UNI.
- Uniswap maintains a neutral-to-bullish tone, supported by a trailing SuperTrend indicator.
Uniswap (UNI) edges higher near an immediate resistance at $3.88 on Tuesday. The native decentralized exchange (DEX) token is defying a broader correction in the cryptocurrency market, even as Bitcoin (BTC) falls toward $63,000 from its July highs around $67,000.
Uniswap rises as retail buying absorbs selling pressure
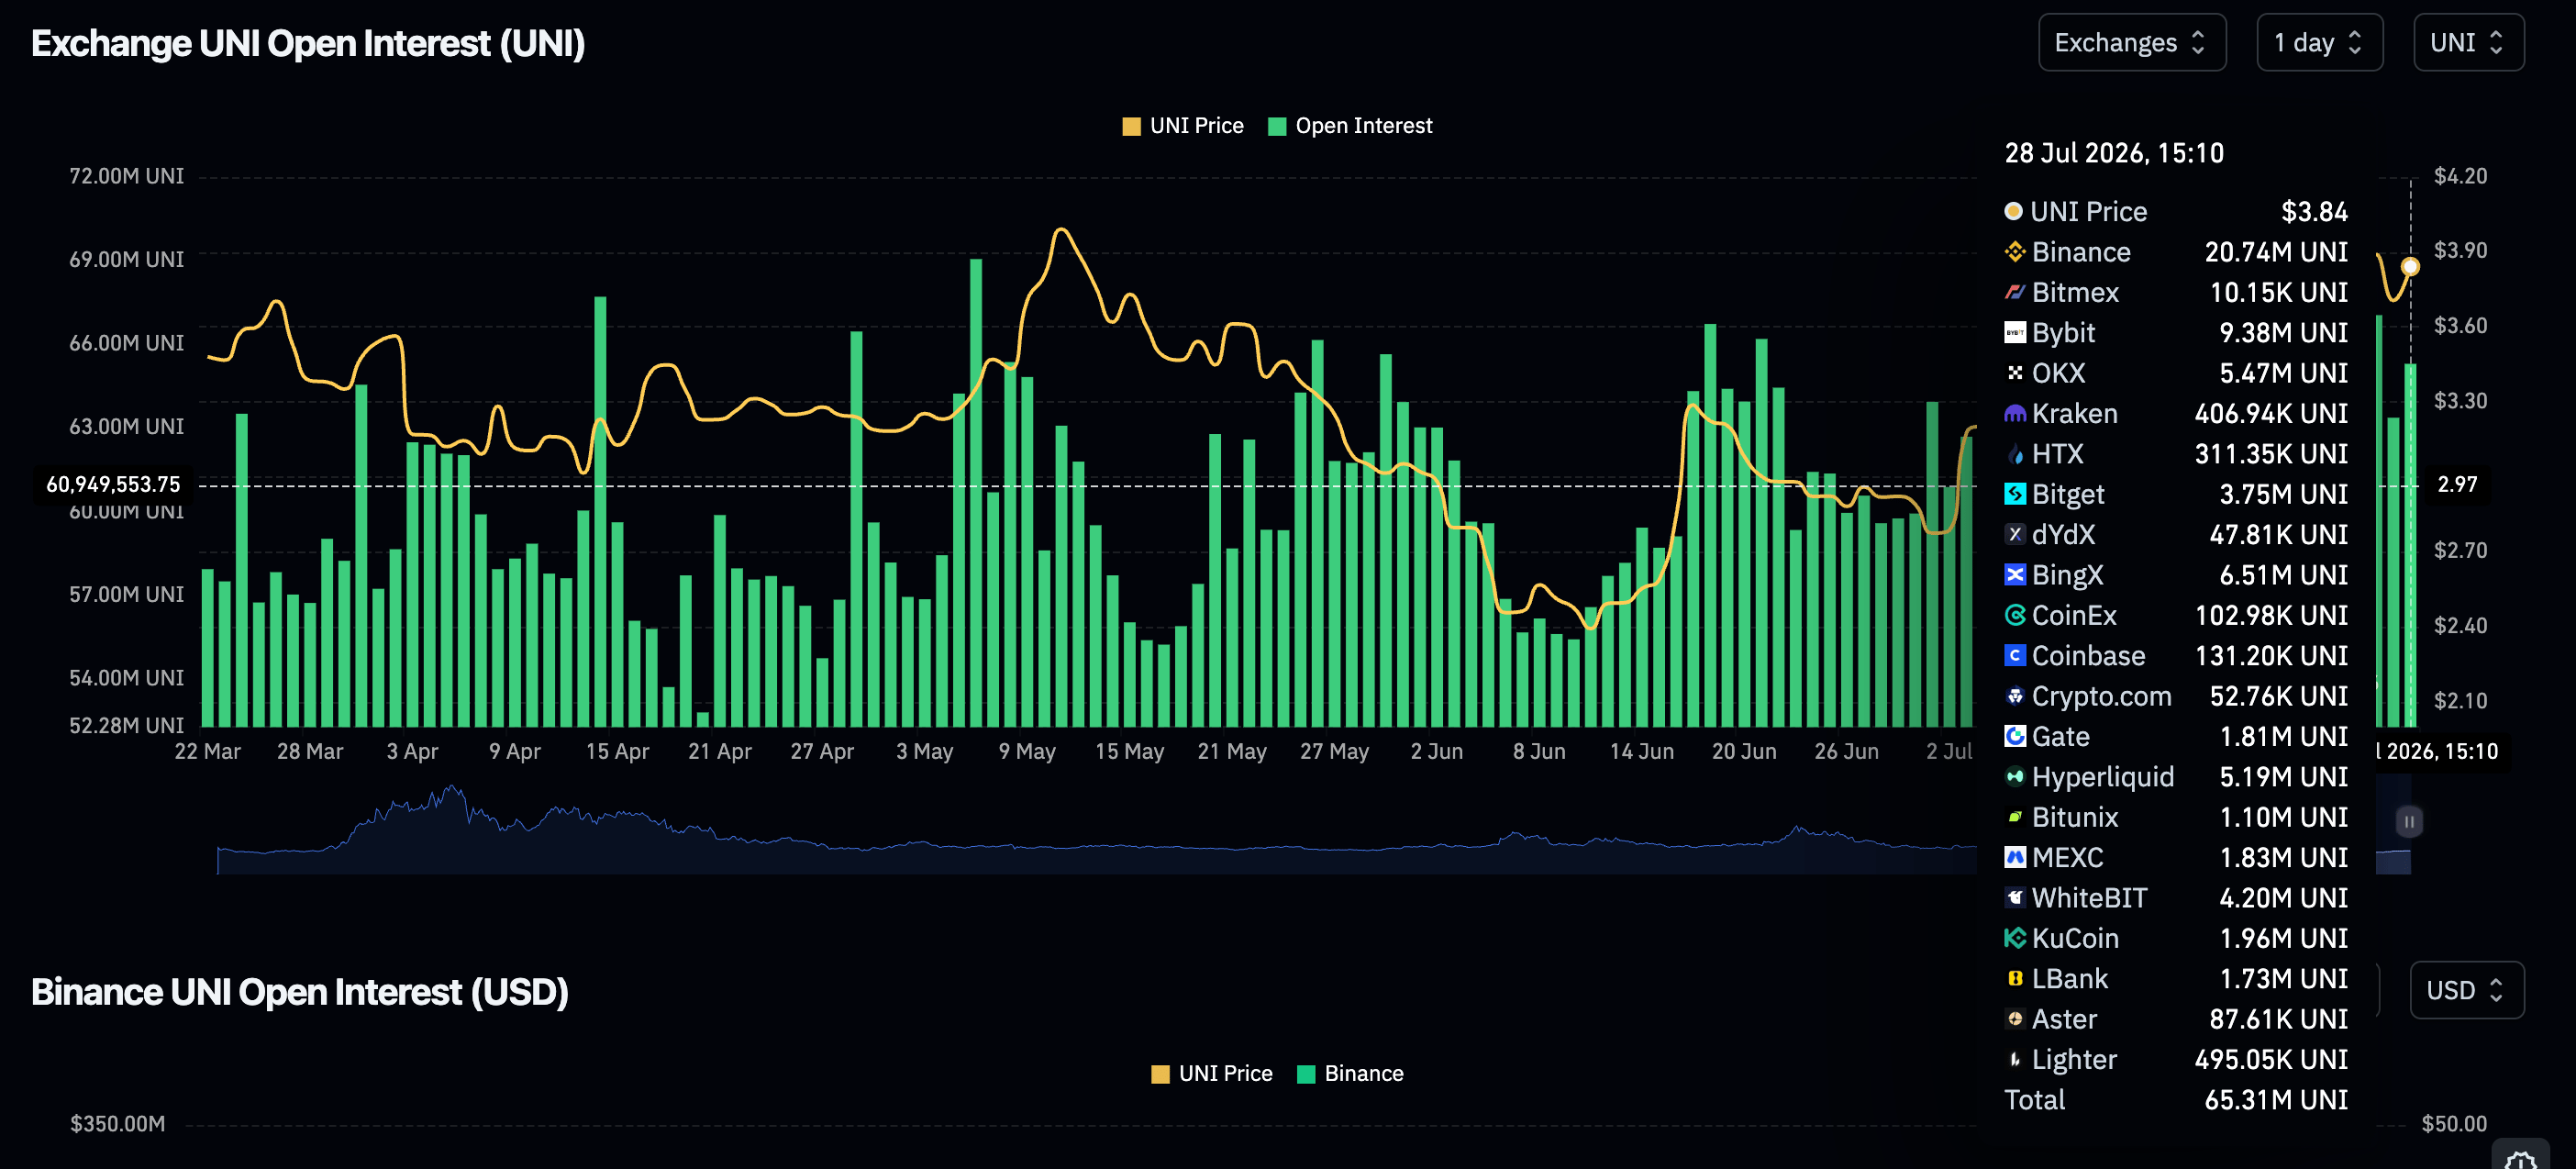
Retail appetite is gaining momentum across Uniswap derivatives, as evidenced by perpetual futures Open Interest (OI) rising to 65 million UNI on Tuesday, from approximately 63 million the day before. The rebound traces back to roughly 60 million in OI recorded on July 19, underscoring growing risk-on sentiment despite headwinds in the broader crypto market.
Looking back, Uniswap’s neutral-to-bullish outlook can also be attributed to strategic ecosystem growth, such as the network’s partnership with Securitize on permissioned pools. The new standard, announced last Tuesday, gives regulated assets access to automated market making (AMM) liquidity while preserving issuer-defined controls.
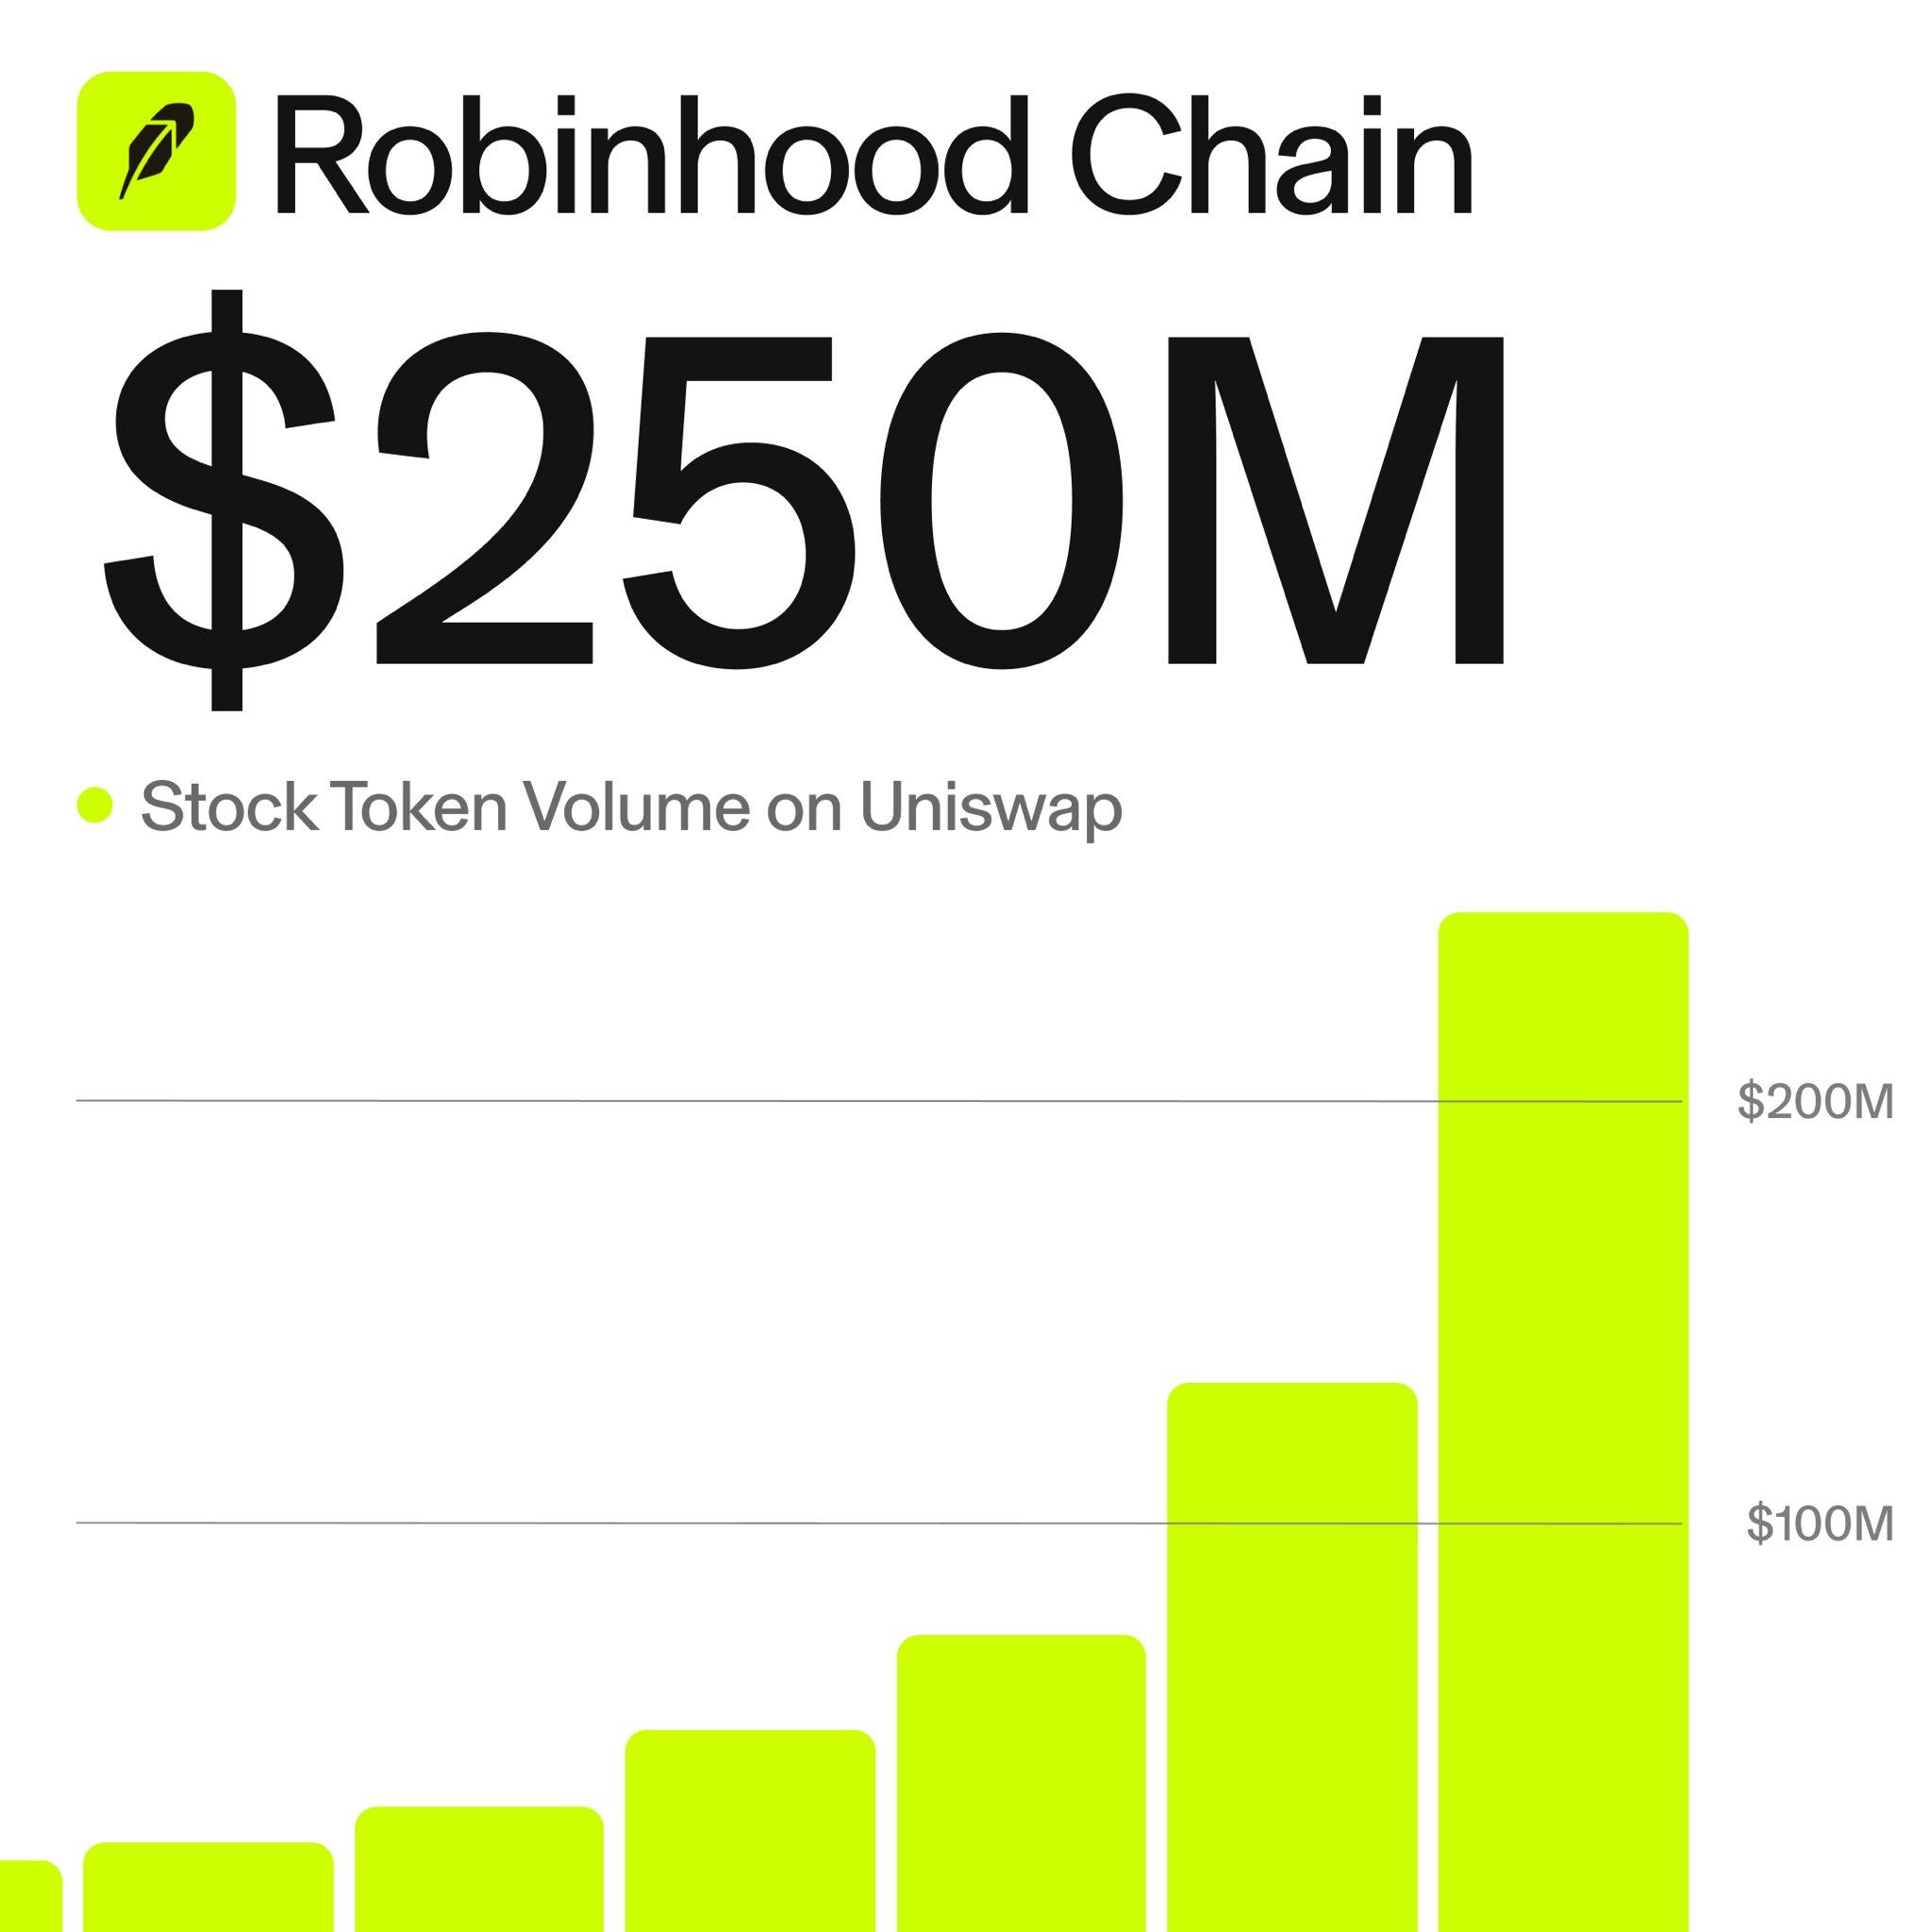
The protocol’s contribution to the real-world assets (RWAs) sector has also sustained impressive growth, with processed stock token volume on Robinhood Chain rising to $250 million.
Price analysis: Uniswap upholds positive momentum
Uniswap trades at $3.86, maintaining a constructive near-term bullish bias as it holds above the SuperTrend line at $3.23 and the medium-term Exponential Moving Averages (EMAs), with the 50-day EMA at $3.40 and the 100-day EMA at $3.39. The spot price has also reclaimed the descending resistance trendline, now offering structural support near $3.52, while momentum remains positive but not overextended.
At the same time, the Relative Strength Index (RSI) around 62 on the daily chart hints at sustained buying interest despite a flattening Moving Average Convergence Divergence (MACD) histogram just below the zero mark.
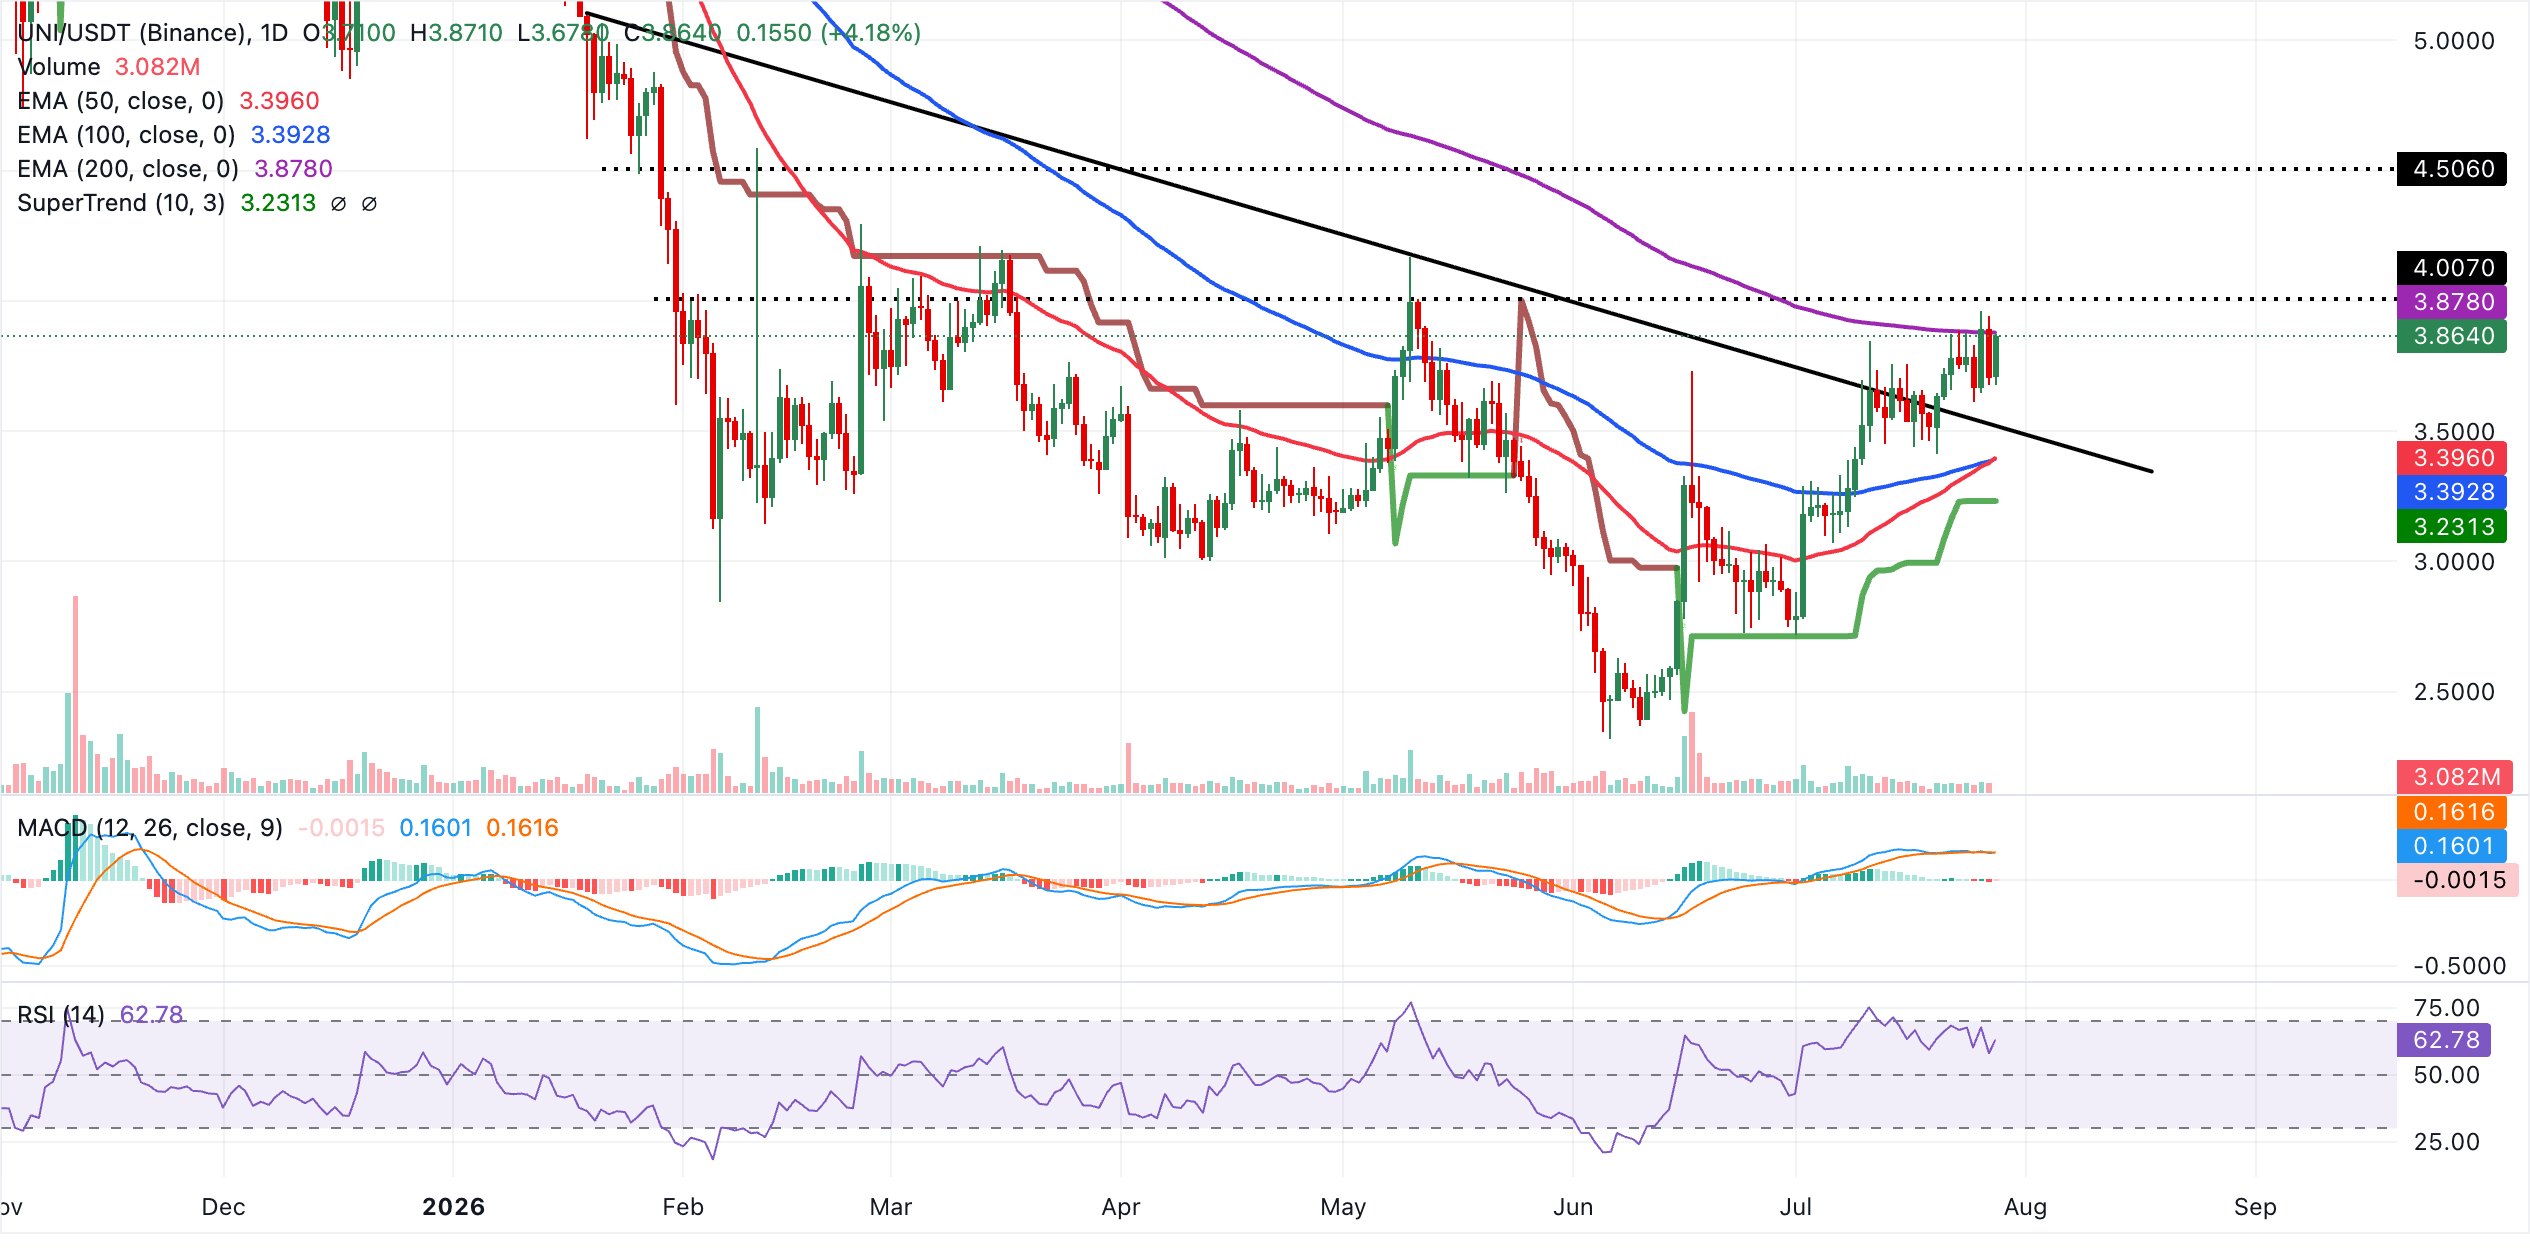
Immediate resistance lies at the 200-day EMA at around $3.88. A sustained break above this barrier would strengthen the bullish case for further recovery. On the downside, initial support is aligned with the descending trendline area at $3.52, followed by the clustered 50-day and 100-day EMAs near $3.40. The SuperTrend base at $3.23 marks a deeper but still constructive demand zone as long as daily closes remain above it.
(The technical analysis of this story was written with the help of an AI tool. Know more.)
Open Interest, funding rate FAQs
Higher Open Interest is associated with higher liquidity and new capital inflow to the market. This is considered the equivalent of increase in efficiency and the ongoing trend continues. When Open Interest decreases, it is considered a sign of liquidation in the market, investors are leaving and the overall demand for an asset is on a decline, fueling a bearish sentiment among investors.
Funding fees bridge the difference between spot prices and prices of futures contracts of an asset by increasing liquidation risks faced by traders. A consistently high and positive funding rate implies there is a bullish sentiment among market participants and there is an expectation of a price hike. A consistently negative funding rate for an asset implies a bearish sentiment, indicating that traders expect the cryptocurrency’s price to fall and a bearish trend reversal is likely to occur.
Recommended Articles


