


Bitcoin (BTCUSD) Fluctuated Significantly on Sep 19: Key Variables Behind the Move
Bitcoin (BTCUSD) is up 5.95% at Sep 19 20:45(ET), now at $81080.01, with a 7-day up of 5.11%.
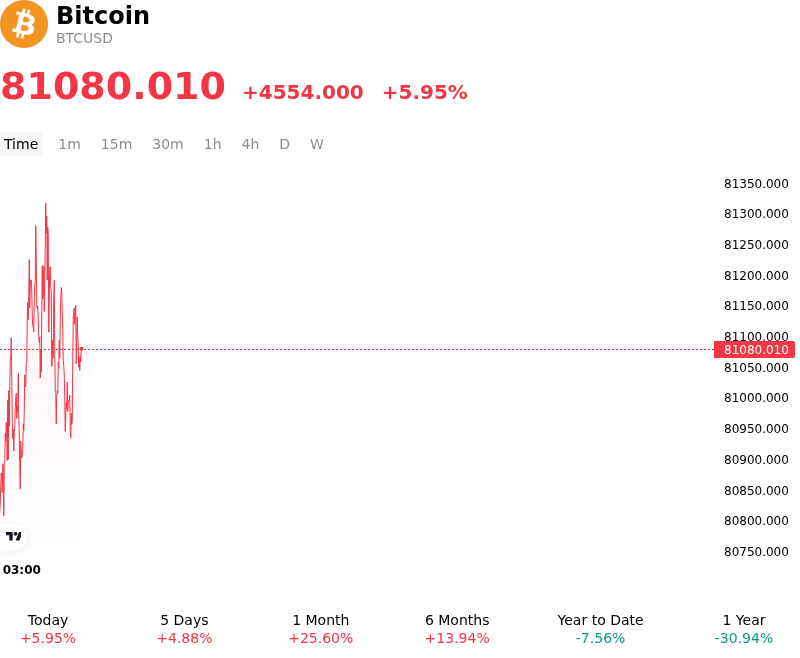
What is driving Bitcoin (BTCUSD)’s stock price up today?
Bitcoin's upside push above key resistance levels reflects a combination of easing macroeconomic headwinds, renewed institutional spot demand, and positive regulatory developments. Following the Federal Reserve's well-anticipated monetary policy decision, macroeconomic anxiety subsided as crude oil prices pulled back from recent highs and Treasury yields stabilized. This macro relief revived risk appetite across broader asset classes, encouraging institutional capital flows back into spot digital assets. Continued spot Bitcoin ETF net inflows provided an underlying baseline of spot demand, helping absorb market overhead and anchoring market liquidity.
Sentiment across the digital asset space was further bolstered by micro-level structural catalysts. The Securities and Exchange Commission granted conditional regulatory relief for tokenized traditional asset trading, which revitalized long-term adoption expectations and institutional interest in blockchain-native financial infrastructure. Although broader legislative initiatives in Congress experienced delays earlier in the week, targeted regulatory clarity provided a constructive floor for market participants, supporting institutional participation and long-term asset allocation frameworks.
The move was significantly amplified by leverage dynamics within crypto derivatives markets. As Bitcoin pushed past psychological resistance around key price thresholds, aggressive short covering triggered a substantial liquidation cascade. Hundreds of millions of dollars in short derivative positions were forcibly unwound within a compressed time window, creating a localized buy-side liquidity squeeze. This forced buying accelerated the upward momentum, pushing order books into thinner depth and driving spot prices higher.
While the immediate rally demonstrates robust market absorption and strong structural demand, institutional investors remain attentive to ongoing macro and liquidity risks. The potential for persistent inflationary pressures, elevated benchmark yields, and broader tight monetary conditions continues to pose headline risk. Additionally, the reliance on short-covering momentum suggests that spot buyers must sustain continuous ETF inflows and wallet accumulation to solidify these higher price levels into key support zones.
Technical Analysis of Bitcoin (BTCUSD)
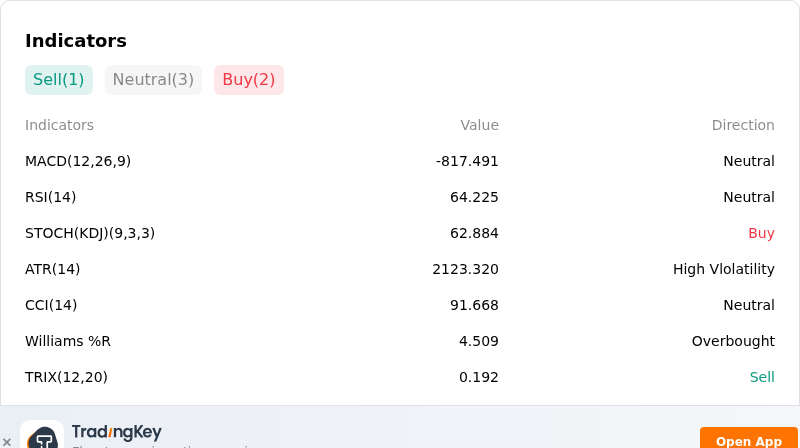
Technically, Bitcoin (BTCUSD) shows a MACD (12,26,9) value of -817.491, indicating a neutral signal. The RSI at 64.225 suggests neutral condition and the Williams %R at 4.509 suggests overbought condition. Please monitor closely.
More details about Bitcoin (BTCUSD)
Recent Events and Risks:
- U.S. Legislative & Regulatory Setbacks: The U.S. Senate failed to advance the Digital Asset Market CLARITY Act after a key procedural vote stalled, rekindling legal and structural compliance uncertainty for institutional crypto operations.
- Heavy Institutional ETF Outflows: U.S. spot Bitcoin ETFs experienced severe net daily capital outflows exceeding $450 million across leading funds, driven by substantial redemptions in major products like Fidelity's FBTC and BlackRock's IBIT, stripping critical spot demand from the market.
- Macro Tightening & Monetary Policy Pressure: The Federal Reserve delivered an unexpected interest rate hike alongside elevated 10-year U.S. Treasury yields, tightening broader macro liquidity and driving risk-off sentiment across digital asset markets.
- Derivatives Leverage & Liquidation Cascades: Accumulation of long leverage around the $75,000–$76,000 key support range leaves market structure vulnerable to sharp downside sweeps and forced liquidation unwinds if sell-side pressure breaches critical technical thresholds.
Recommended Articles


