


Uniswap Price Forecast: Rising stablecoin activity fuels UNI bullish rally chances
- Uniswap is up 3% on Friday, extending its rebound from the 50-day EMA at $3.08.
- Uniswap processed 58% of EVM stable-to-stable swap volume over the last 30 days, highlighting its growing market share.
- Retail demand builds around Uniswap as Open Interest rises 5% in 24 hours, with a positive spike in the funding rate.
Uniswap (UNI) is up 3% at press time on Friday, extending a three-day streak of steady recovery above its 50-day Exponential Moving Average (EMA) around $3.08. Uniswap’s rising market share in stable-to-stable swap volume to 58% over the last 30 days reflects increased network demand. Rising retail demand, with a 5% jump in UNI futures Open Interest, suggests further upside.
Uniswap should clear overhead barriers, including the 200-day EMA barrier at $3.90 and a previous swing high near $4.17, for a sustained rally.
Rising stablecoin activity on Uniswap fuels retail demand
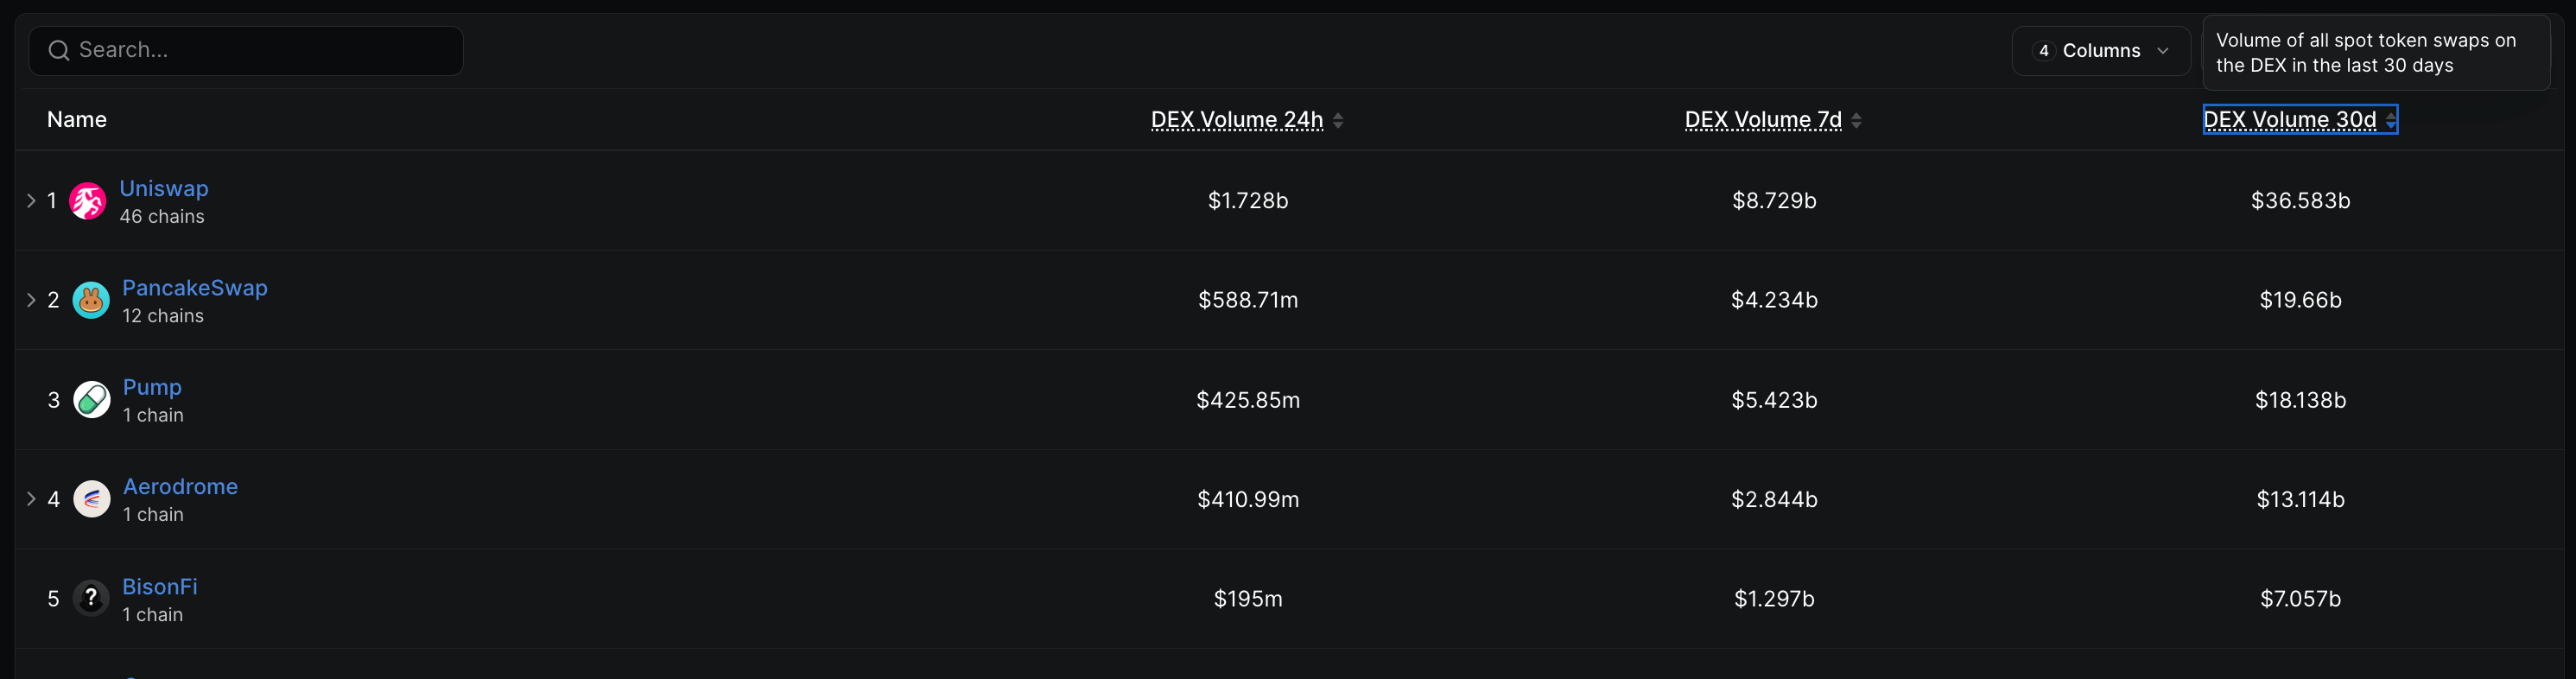
Uniswap announced in a social media post that it processed 58% of all stablecoin-to-stablecoin swap volume over the last 30 days. Typically, an increase in stablecoin activity on a Decentralized Exchange (DEX) like Uniswap translates into increased liquidity, enabling more efficient transfers. DeFiLlama data shows the 7-day DEX volume on Uniswap is roughly $8.73 billion on Friday, outpacing other DeFi protocols, including PancakeSwap and Pump.fun.
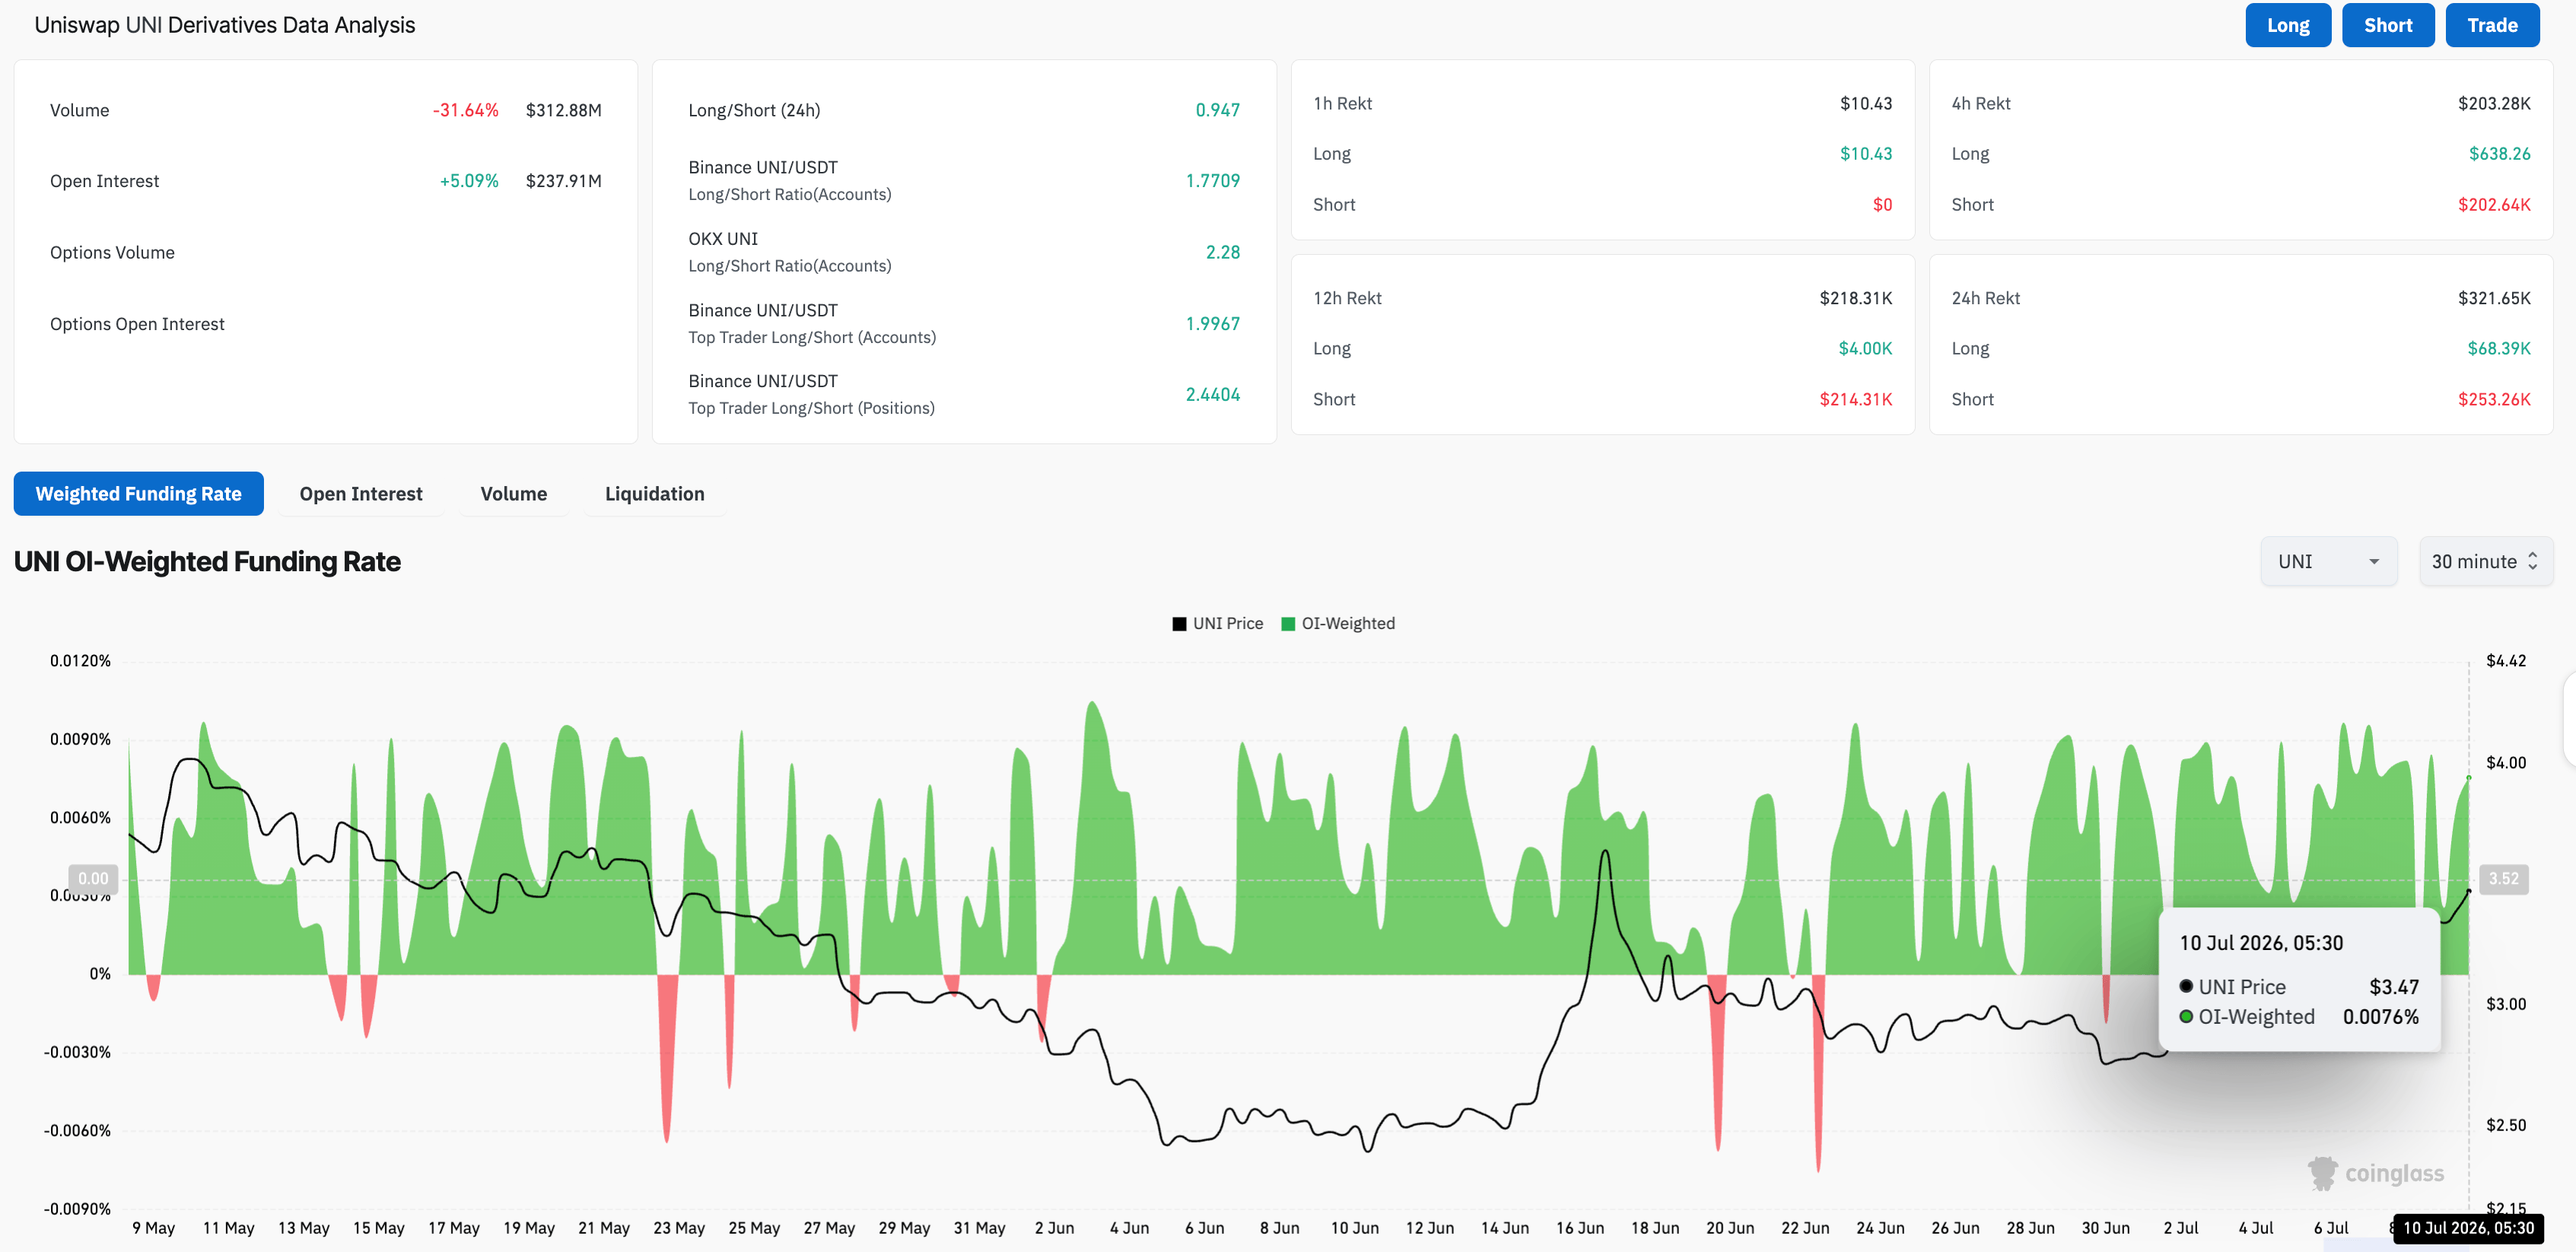
On the retail side, a positional buildup is seen in UNI futures as speculative demand rises. CoinGlass data shows the Open Interest (OI) is up 5% over the last 24 hours to $237.91 million, indicating a rise in the notional value of open contracts, while the funding rate of 0.0076% reflects a bullish bias in the positional buildup, with traders willing to buy long positions at a premium.
Will Uniswap price extend its gains toward the 200-day EMA?
Uniswap hovers around $3.50 on Friday, maintaining a bullish near-term bias as price rises above the 50-day EMA at $3.08 and the 50% retracement of the $4.20 to $2.31 downswing at $3.10. From a technical perspective, Uniswap remains capped below the 200-day EMA at $3.90, which serves as immediate resistance, with the previous swing high at $4.20 as the next level of resistance.
Momentum on the daily chart suggests buyers remain in control. The Relative Strength Index (RSI) at 71 sits in overbought territory, while Moving Average Convergence Divergence (MACD) maintains an uptrend in the positive territory with its signal line. Together, the indicators suggest firm but stretched upside momentum.
On the downside, the initial support zone is now seen at the 50% retracement and the 50-day EMA near $3.10, where a pullback could attract dip-buying interest.
(The technical analysis of this story was written with the help of an AI tool. Know more.)
Recommended Articles


