

Cardano Price Forecast: Consolidation near support as bearish momentum eases

Source Fxstreet
  • Cardano price consolidates around $0.146 on Wednesday after a recent sell-off.
  • Weakening derivatives activity, with declining open interest and rising short positions, continues to support a cautious near-term outlook.
  • The technical outlook shows bearish momentum is fading, raising the possibility of a potential recovery.

Cardano (ADA) trades around $0.146 on Wednesday, stabilizing after a sharp correction as selling pressure eases. Weakening derivatives metrics indicate traders remain cautious, while fading bearish momentum indicators suggest a potential recovery for ADA.

Derivatives traders remain cautious

Cardano’s derivatives metrics support a negative outlook. ADA’s futures Open Interest (OI) dropped to $360 million on Wednesday after a mild rise in mid-May but has been continuously falling since mid-January. This drop in OI reflects waning investor participation and projects a bearish outlook.
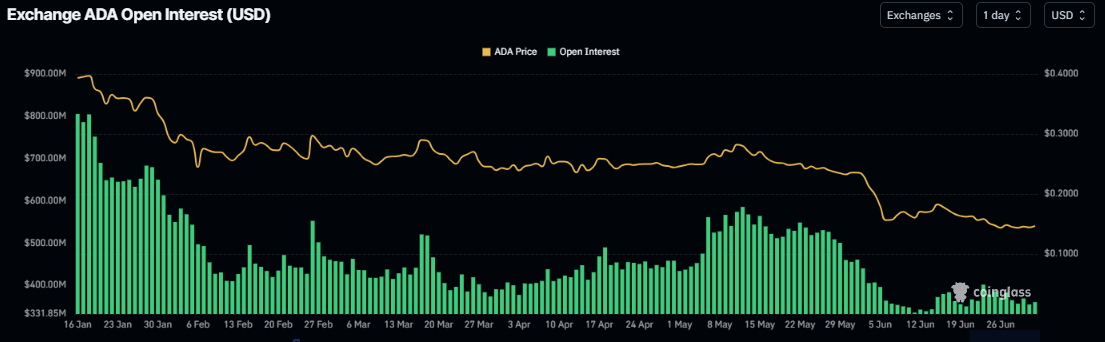
Cardano open interest chart. Source: SoSoValue

In addition, CoinGlass’ long-to-short ratio for ADA reads 0.69 on Wednesday, nearing its lowest level in over a month. This ratio, being below one, reflects bearish sentiment in the market, as more traders are betting on the asset’s price to fall.
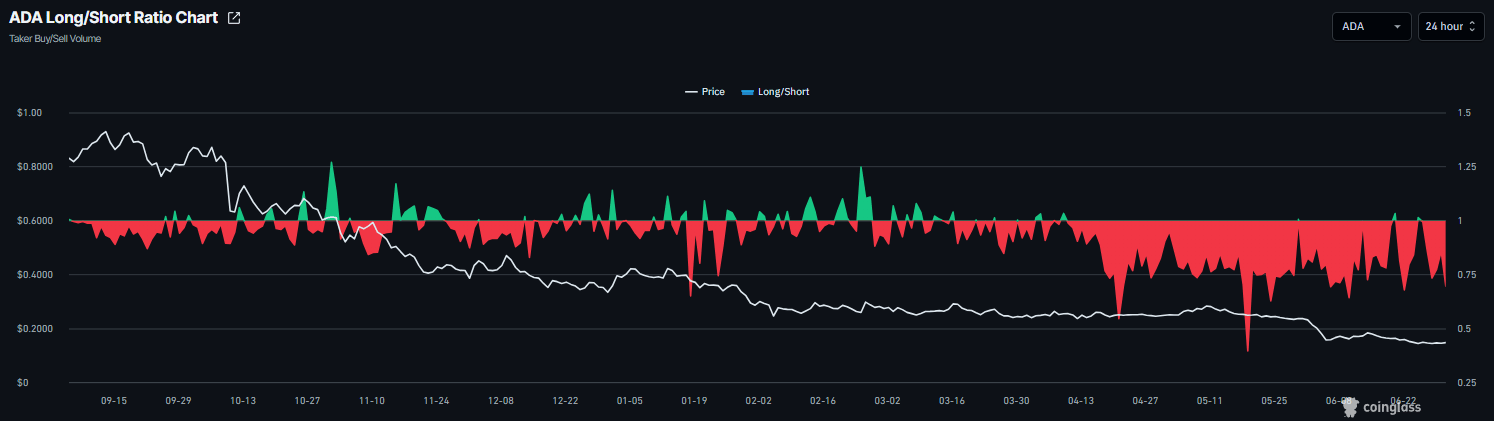
ADA long-to-short ratio chart. Source: Coinglass

Some signs of optimism

CryptoQuant’s summary data shows mild bullish sentiment. Cardano’s spot markets show large whale orders amid neutral conditions across other metrics, supporting a potential recovery.
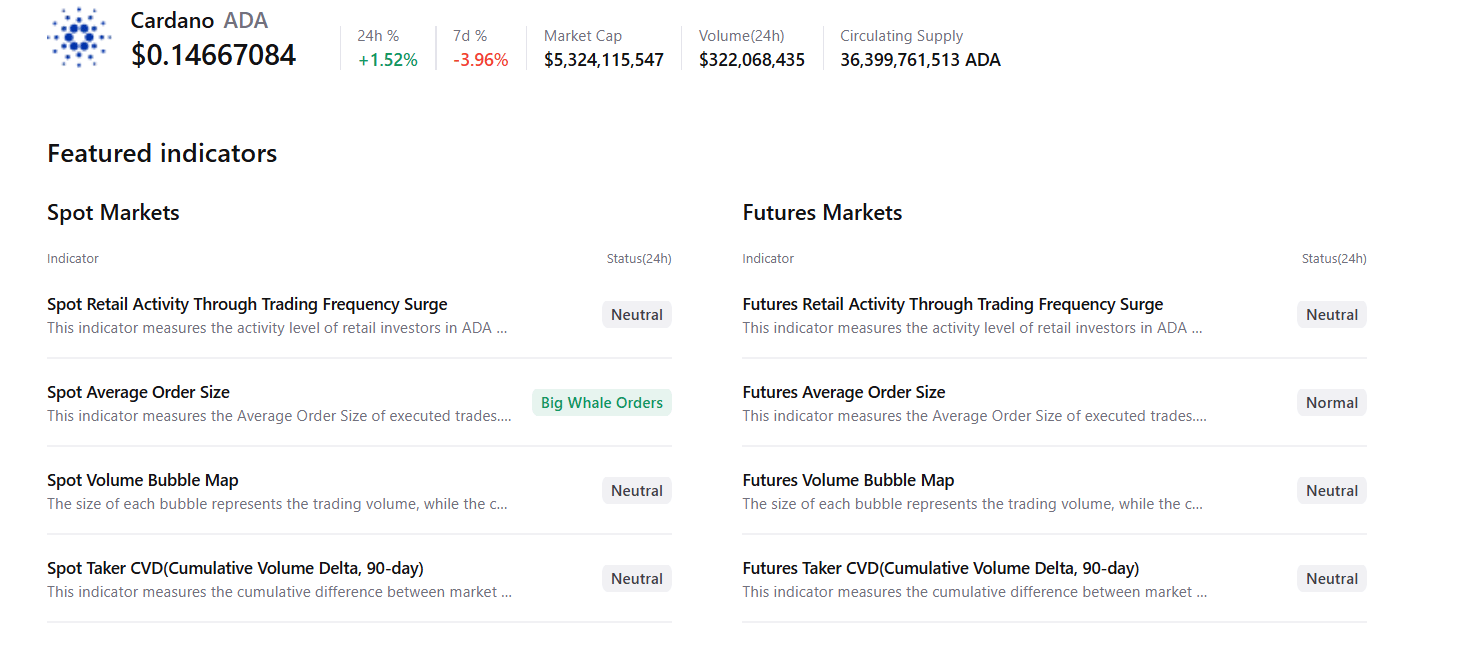
Cardano Price Forecast: Fading bearish momentum

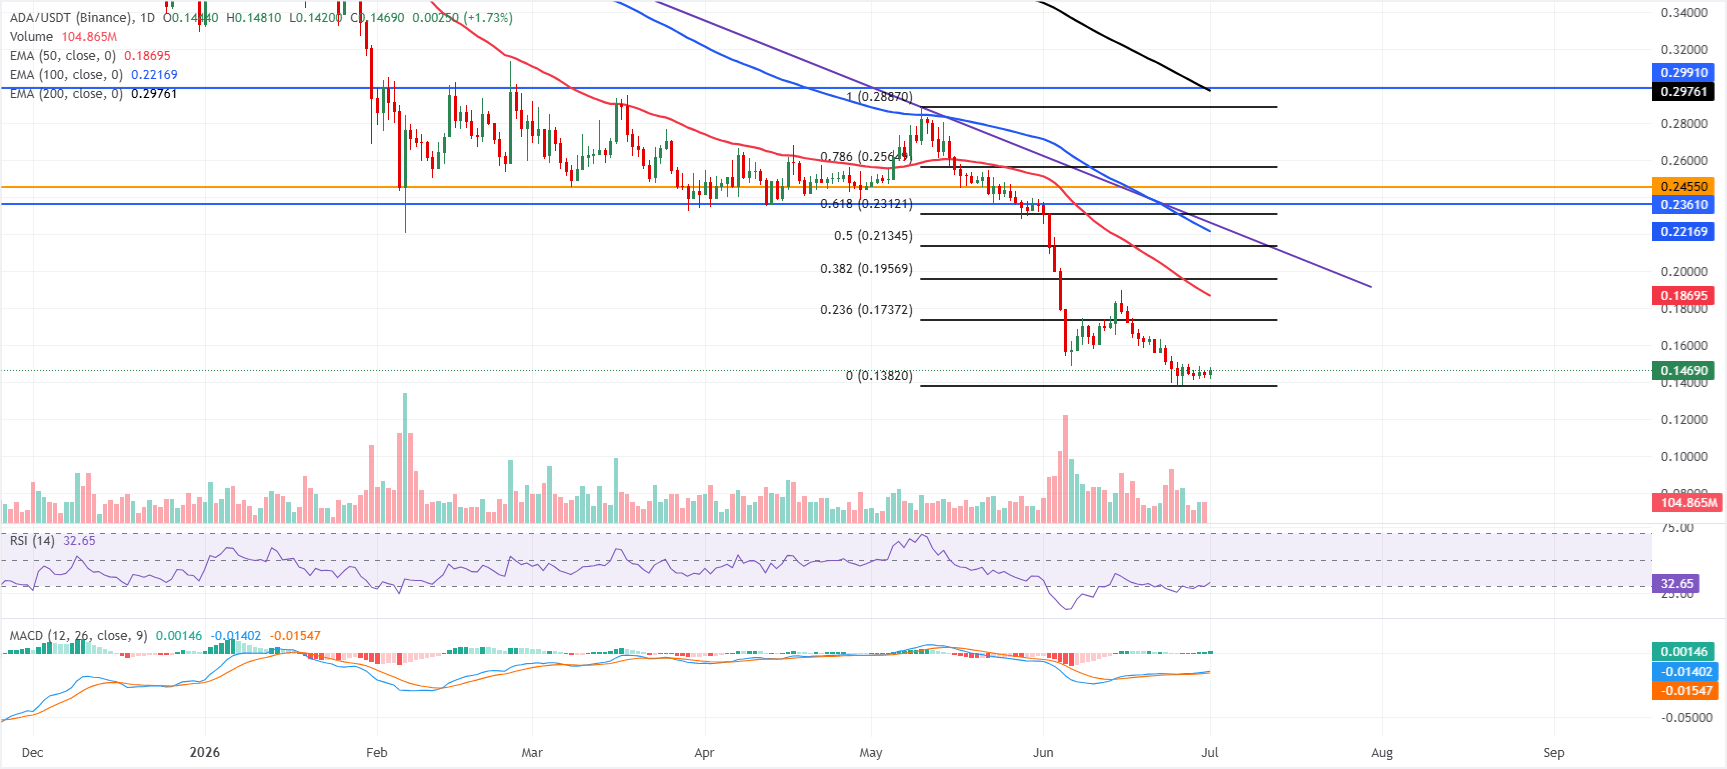
Cardano price trades at $0.146 on Wednesday, consolidating after a recent correction. However, ADA maintains a long-term bearish bias, with price holding well below the 50-day, 100-day, and 200-day Exponential Moving Averages (EMAs) at roughly $0.187, $0.221, and $0.297.

The Relative Strength Index (RSI) has stabilized near 33, and the Moving Average Convergence Divergence (MACD) line remains slightly positive, hinting at tentative downside fatigue but not yet altering the overarching downward structure.

On the topside, initial resistance is seen at the 23.6% Fibonacci retracement near $0.173, ahead of the 50-day EMA around $0.187 and the 38.2% Fibonacci retracement close to $0.1957. Further up, the 50% retracement level at $0.213, the 100-day EMA at $0.221 and the downtrend resistance trendline’s break area near $0.226 form a broader supply band, followed by clustered barriers between the 61.8% Fibonacci retracement at $0.231, horizontal caps at $0.236 and $0.245, and the upper band defined by $0.256–$0.299 including the 78.6% Fibonacci retracement, the 200-day EMA around $0.2976 and overhead horizontal resistance. 

On the downside, immediate support sits at the Fibonacci anchor at $0.1382; a clear break below this floor would expose fresh lows in the broader downtrend.
(The technical analysis of this story was written with the help of an AI tool.)

Disclaimer: For information purposes only. Past performance is not indicative of future results.
placeholder
WTI Crude Slips Below $90 as Easing Mideast Tensions and Supply Dynamics Flash Bearish Signals WTI crude breached the critical $90 threshold as fading Middle East risks and technical breakdowns signaled a bearish pivot, leaving oil vulnerable to further downside toward $85.
Author  Mitrade Team
Jun 09, Tue
WTI crude breached the critical $90 threshold as fading Middle East risks and technical breakdowns signaled a bearish pivot, leaving oil vulnerable to further downside toward $85.
placeholder
XRP Price Prediction for July 2026: Can Buyers Finally Break the Downtrend?XRP (XRP) price trades near $1.05, caught between a year-long downtrend and a sudden burst of buying.July has historically rewarded XRP holders. This year the month arrives with on-chain accumulation
Author  Beincrypto
Jun 30, Tue
XRP (XRP) price trades near $1.05, caught between a year-long downtrend and a sudden burst of buying.July has historically rewarded XRP holders. This year the month arrives with on-chain accumulation
placeholder
Gold Price Analysis Today: Gold Drops 1.32% Despite Lower Fed Rate-Hike Bets, Can $4,313 Support Hold? Gold fell 1.32% on August 13 after rising to $4,449.73, then reversing lower and closing near $4,349.918 below the $4,356.46 support. Softer US inflation data reduced Fed rate hike expectations, but selling pressure still dominated the session. Will $4,313 support hold?
Author  Naoufal Seddik
Aug 14, Fri
Gold fell 1.32% on August 13 after rising to $4,449.73, then reversing lower and closing near $4,349.918 below the $4,356.46 support. Softer US inflation data reduced Fed rate hike expectations, but selling pressure still dominated the session. Will $4,313 support hold?
placeholder
Gold Price Analysis Today: Gold Gains 0.94% as Markets Expect Fed to Hold Rates, Can $4,449 Resistance Break? Gold gained 0.94% on August 17, closing near $4,417.30 as softer US data strengthened expectations for unchanged Fed rates in September. Gold remains bullish, with $4,449.730 resistance and $4,310.650 support in focus.
Author  Naoufal Seddik
Aug 18, Tue
Gold gained 0.94% on August 17, closing near $4,417.30 as softer US data strengthened expectations for unchanged Fed rates in September. Gold remains bullish, with $4,449.730 resistance and $4,310.650 support in focus.
placeholder
Gold Price Analysis Today: Gold Rebounds After 1.91% Drop as Yields Ease. Is $4,449 Next? Gold fell about 1.91% on August 18 before producing a strong bullish reaction from the 1-hour demand zone in early August 19 trading. RSI is recovering from oversold conditions, but Supertrend remains bearish as traders await the Fed minutes.
Author  Naoufal Seddik
Aug 19, Wed
Gold fell about 1.91% on August 18 before producing a strong bullish reaction from the 1-hour demand zone in early August 19 trading. RSI is recovering from oversold conditions, but Supertrend remains bearish as traders await the Fed minutes.
Related Instrument
goTop
quote