


Silver Price Forecast: XAG/USD regains ground near $65.70, focus shifts to US NFP
- Silver price recovers to near $67.00 while investors shift their focus to the US NFP data.
- Fed Chair Warsh warns of upside inflation risks at the Jackson Hole Symposium.
- Higher oil prices pressurized Silver price in the opening session.
Silver price (XAG/USD) is up 1% to near $67.00 during the European trading session on Monday. The white metal bounces back after a weak opening near $65.67, with investors shifting their focus to the United States (US) Nonfarm Payrolls (NFP) data for August on Friday.
Investors will pay close attention to the official employment data as the July report, which showed that employers fired 23K workers, led to a sharp downward revision in hawkish Federal Reserve (Fed) expectations.
The Silver price opened lower, continuing Friday’s massive sell-off, driven by Fed’s repetitive warning of upside inflation risks.
On Friday, Fed Chairman Kevin Warsh at the Jackson Hole Symposium reiterated the need to bring inflation down to the 2% target.
Fed chair Warsh strikes a tougher tone on inflation at Jackson Hole
Analysts at Rabobank note that Fed Chair Kevin Warsh “appeared to rebuild some of his credibility as an inflation fighter” in his first speech at the annual Jackson Hole Symposium, stressing that the Federal Reserve still has “work to do” to return inflation to its 2% target. They highlight the address as “an important shift from the communication strategy he had followed since taking office,” with Warsh, for the first time as Chair, explicitly voicing dissatisfaction with recent inflation developments and signalling that he was open to further rate hikes unless underlying inflation began to improve convincingly. As Rabobank points out, Warsh underscored that “we must be convinced that underlying inflation is moving toward our target clearly and at a sufficient pace. Otherwise, we still have work to do.”
Such a scenario bodes poorly for non-yielding assets, like Silver.
Higher oil prices due to renewed tensions between the US and Iran also pressured the Silver price in the opening session.
Us–Iran strikes resume, adding to geopolitical risk backdrop
Strategists at Rabobank highlight a renewed escalation in Middle East tensions, noting that “over the weekend, the US and Iran exchanged strikes for the first time in more than a month,” with Iran launching “a missile-and-drone attack on US air bases in Jordon early Monday in response to an American airstrike on Iranian rocket launchers on Sunday.” They flag this latest exchange as a reminder of how quickly geopolitical risks can re-emerge and potentially complicate the inflation and policy outlook.
Silver Technical Analysis
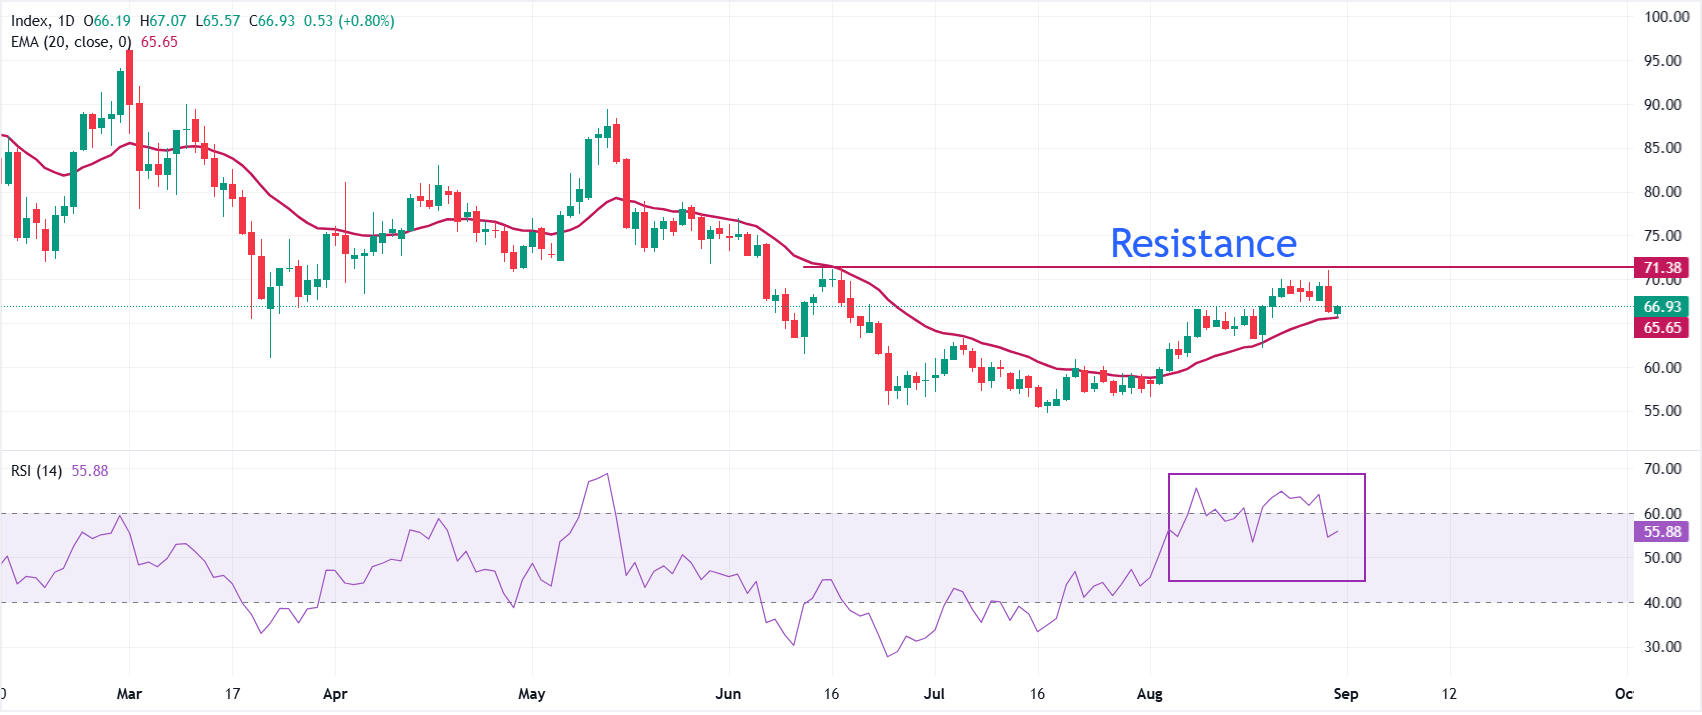
In the daily chart, XAG/USD trades at $66.93, holding above the 20-day Exponential Moving Average (EMA) at $65.65, which suggests a constructive near-term bias. The metal has extended its advance away from the mid-$50s area and now consolidates at elevated levels, while the Relative Strength Index (RSI) around 56 points to moderately positive momentum without yet reaching overbought conditions.
On the downside, immediate support is seen at the $66.93 area, where the latest close defines a near-term pivot, followed by the 20-day EMA at $65.65, which reinforces the broader bullish structure. As long as price stays above this moving average floor, pullbacks are likely to be treated as corrective rather than the start of a deeper reversal.
(The technical analysis of this story was written with the help of an AI tool. Know more.)
Silver FAQs
Silver is a precious metal highly traded among investors. It has been historically used as a store of value and a medium of exchange. Although less popular than Gold, traders may turn to Silver to diversify their investment portfolio, for its intrinsic value or as a potential hedge during high-inflation periods. Investors can buy physical Silver, in coins or in bars, or trade it through vehicles such as Exchange Traded Funds, which track its price on international markets.
Silver prices can move due to a wide range of factors. Geopolitical instability or fears of a deep recession can make Silver price escalate due to its safe-haven status, although to a lesser extent than Gold's. As a yieldless asset, Silver tends to rise with lower interest rates. Its moves also depend on how the US Dollar (USD) behaves as the asset is priced in dollars (XAG/USD). A strong Dollar tends to keep the price of Silver at bay, whereas a weaker Dollar is likely to propel prices up. Other factors such as investment demand, mining supply – Silver is much more abundant than Gold – and recycling rates can also affect prices.
Silver is widely used in industry, particularly in sectors such as electronics or solar energy, as it has one of the highest electric conductivity of all metals – more than Copper and Gold. A surge in demand can increase prices, while a decline tends to lower them. Dynamics in the US, Chinese and Indian economies can also contribute to price swings: for the US and particularly China, their big industrial sectors use Silver in various processes; in India, consumers’ demand for the precious metal for jewellery also plays a key role in setting prices.
Silver prices tend to follow Gold's moves. When Gold prices rise, Silver typically follows suit, as their status as safe-haven assets is similar. The Gold/Silver ratio, which shows the number of ounces of Silver needed to equal the value of one ounce of Gold, may help to determine the relative valuation between both metals. Some investors may consider a high ratio as an indicator that Silver is undervalued, or Gold is overvalued. On the contrary, a low ratio might suggest that Gold is undervalued relative to Silver.
Recommended Articles


