


WTI posts fresh monthly high near $100.50 as Iran continues attacks on oil tankers
- The Oil price jumps to near $100.50 amid continuous Iran’s attacks on oil tankers.
- Iran warns extending the scope of blockade to the Bab al-Mandeb Strait and the Suez Canal.
- Ukraine resumes attacks on Russian oil infrastructure, accusing the US for betrayel.
West Texas Intermediate (WTI), futures on NYMEX, trades 2.5% higher to near $100.50, the highest level seen in over a month. The oil price is little far from revisiting its almost five-month high of $102.11.
The risk premium over oil prices is surging due to escalating energy supply risks amid continuous attacks from Iran on oil tankers aiming to pass the Hormuz strait, a critical chokepoint to almost 20% of global energy supply.
According to Reuters, Iran's revolutionary guards' navy said that two tankers were set ablaze by mines and brought to a halt south of the Strait of Hormuz. However, the navy didn’t mention any date.
This weekend, Iran also warned extending the scope of blockade to the Bab al-Mandeb Strait and the Suez Canal, and said that it is prepared for retaliation against US-Israel attacks.
Meanwhile, continuing attacks from Ukraine on Russian oil refineries has dampened the optimism of higher energy supply from Moscow. Ukraine has resumed strikes on Russian oil refineries after President Volodymyr Zelenskyy angrily accused the United States of betraying Kyiv with a “dangerous” withdrawal of support critical to its defense against Russia, NBC news reported.
WTI Technical Analysis
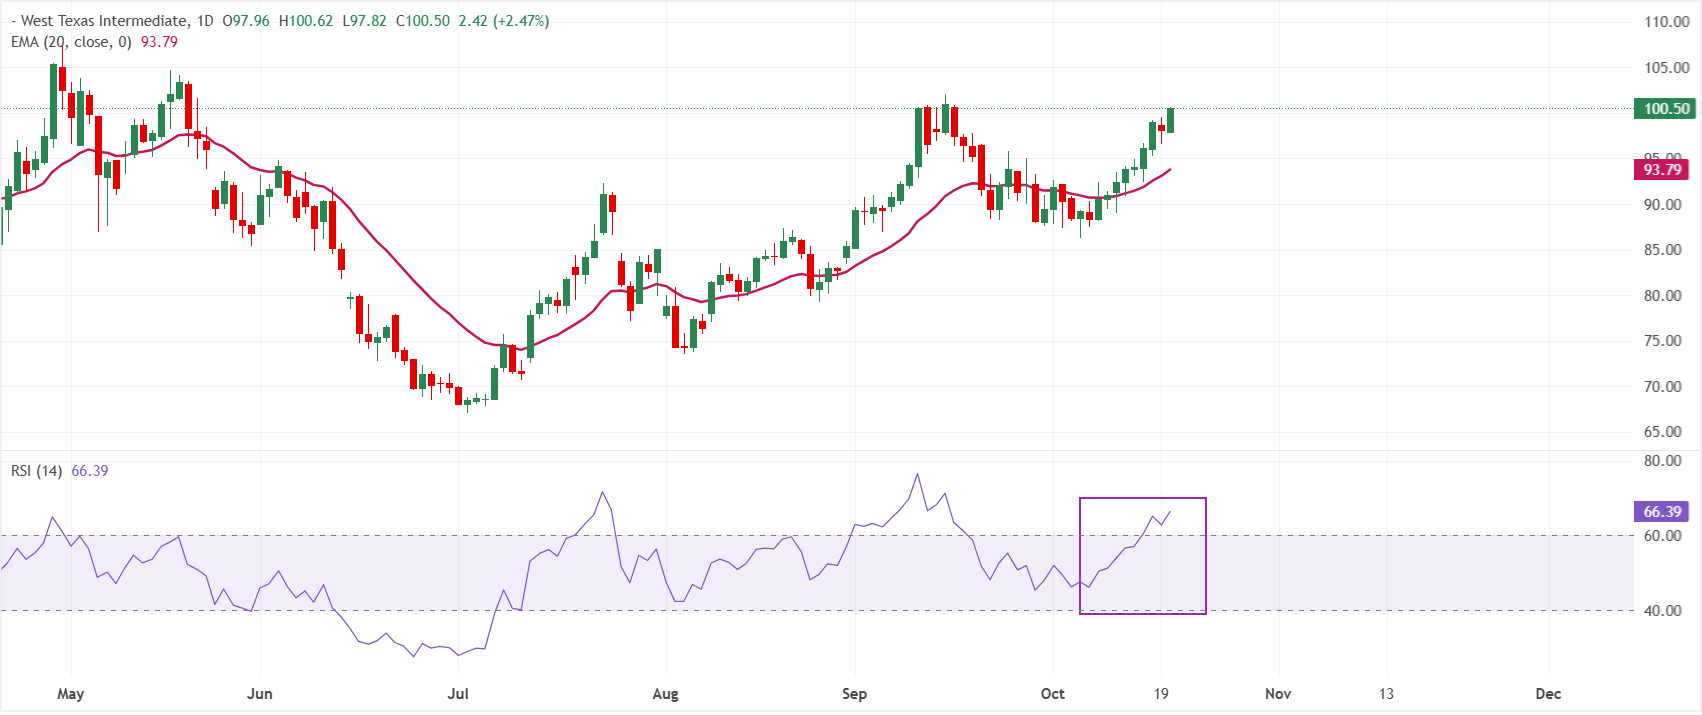
In the daily chart, WTI US Oil trades at $100.49. The contract holds a bullish near-term bias as it remains above the 20-day exponential moving average (EMA) at $93.79, keeping the broader uptrend intact despite recent volatility. The Relative Strength Index (14) at 66.38 stays in positive territory but short of overbought, suggesting that upside momentum is still constructive, though increasingly stretched.
On the downside, initial support emerges at the 20-day EMA at $93.79, where buyers are likely to defend the prevailing trend if a corrective pullback develops. As long as price holds above this underlying demand zone, dip-buying is favored over aggressive selling, with any consolidation likely to be framed as a pause within the broader advance rather than a trend reversal.
(The technical analysis of this story was written with the help of an AI tool. Know more.)
WTI Oil FAQs
WTI Oil is a type of Crude Oil sold on international markets. The WTI stands for West Texas Intermediate, one of three major types including Brent and Dubai Crude. WTI is also referred to as “light” and “sweet” because of its relatively low gravity and sulfur content respectively. It is considered a high quality Oil that is easily refined. It is sourced in the United States and distributed via the Cushing hub, which is considered “The Pipeline Crossroads of the World”. It is a benchmark for the Oil market and WTI price is frequently quoted in the media.
Like all assets, supply and demand are the key drivers of WTI Oil price. As such, global growth can be a driver of increased demand and vice versa for weak global growth. Political instability, wars, and sanctions can disrupt supply and impact prices. The decisions of OPEC, a group of major Oil-producing countries, is another key driver of price. The value of the US Dollar influences the price of WTI Crude Oil, since Oil is predominantly traded in US Dollars, thus a weaker US Dollar can make Oil more affordable and vice versa.
The weekly Oil inventory reports published by the American Petroleum Institute (API) and the Energy Information Agency (EIA) impact the price of WTI Oil. Changes in inventories reflect fluctuating supply and demand. If the data shows a drop in inventories it can indicate increased demand, pushing up Oil price. Higher inventories can reflect increased supply, pushing down prices. API’s report is published every Tuesday and EIA’s the day after. Their results are usually similar, falling within 1% of each other 75% of the time. The EIA data is considered more reliable, since it is a government agency.
OPEC (Organization of the Petroleum Exporting Countries) is a group of 12 Oil-producing nations who collectively decide production quotas for member countries at twice-yearly meetings. Their decisions often impact WTI Oil prices. When OPEC decides to lower quotas, it can tighten supply, pushing up Oil prices. When OPEC increases production, it has the opposite effect. OPEC+ refers to an expanded group that includes ten extra non-OPEC members, the most notable of which is Russia.
Recommended Articles


