

SpaceX Stock Price Forecast: Rebounds to $148 Ahead of Earnings, $152–$160 Becomes Key Resistance Zone


Mitrade Team
coverImg
Source: DepositPhotos

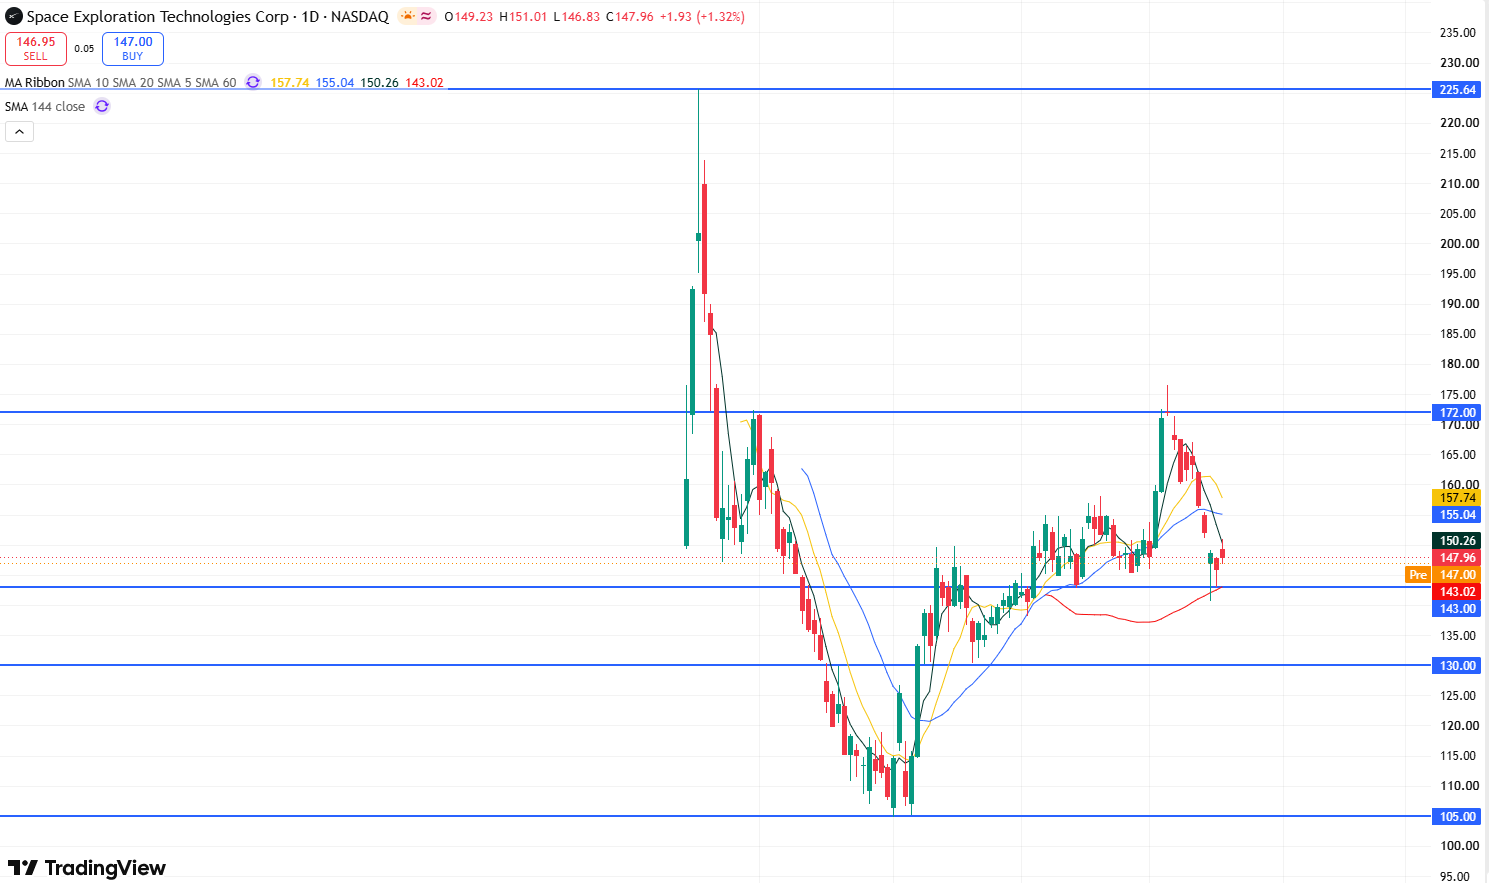
TradingKey - As of the close on Monday (October 19) Eastern Time, SpaceX (SPCX) closed at $147.96, up 1.32% on the day, reaching an intraday high of $151.01. The closing price was noticeably under pressure below $150, indicating that this level has become short-term resistance. Previously, the stock had been continuously pulling back from its recent high of $176.42 on October 6, falling as low as $140.66 on October 15. The stock rebounded on Monday ahead of earnings, with the movement leaning toward a technical recovery following a high-level pullback.

On the fundamentals front, SpaceX is scheduled to release its Q3 2026 financial results after the U.S. market close on October 20, with the earnings conference call set for 16:30 Eastern Time. The market currently expects quarterly revenue of approximately $12.8 billion and a potential first-ever quarterly net profit. The options market implies a potential single-week stock price move of around 7.5% post-earnings, suggesting that technical breakouts or breakdowns could accelerate significantly around the announcement.
spcx-c7f75b14ddcd4a4d8684adef2193d232

SPCX stock daily chart, Source: TradingView

From a technical perspective, SPCX stock has been in a continuous pullback after reaching a recent high of $176.42 on October 6. It formed long lower shadows above $140 on both Thursday and Friday of last week, indicating strong buying support near this level. Additionally, this level sits above the 60-day moving average, potentially forming a confluent support structure that further bolsters short-term bullish momentum and supports Monday's stock rebound.

Regarding technical indicators, the daily Relative Strength Index (RSI) stands at approximately 45.2, recovering slightly from the previous decline. This indicates that selling pressure has eased compared to before, though definitive bullish momentum confirmation has not yet emerged.

On the downside, initial support to watch is at $145–$147. Further down, more crucial support lies at $140–$143, a zone that has consistently attracted buying interest previously. If $140 is breached, the next key support level to watch is near $130.

On the upside, initial resistance is located at $150–$152, a short-term resistance zone formed following the recent gap-down pullback. If the stock regains a firm footing above $152, the next upside target will test the $155–$160 range; further above, attention should be paid to the $172–$176.42 range.

mitrade Don't Miss Today's Market    Moves Start trading Forex, Gold & Crypto today    Regulated platform | Fast withdrawals

The above content was completed with the assistance of AI and has been reviewed by an editor.

goTop
quote
Related Articles
placeholder
Tesla Q3 Earnings Preview: Can Auto Margins Stabilize? Wall Street’s Highest Price Target at $550TradingKey - Tesla (TSLA) will report its third-quarter 2026 financial results after the U.S. stock market close on October 21, Eastern Time, and host an earnings conference call at 17:30 that day. Th
Author  TradingKey
1 hour ago
TradingKey - Tesla (TSLA) will report its third-quarter 2026 financial results after the U.S. stock market close on October 21, Eastern Time, and host an earnings conference call at 17:30 that day. Th
placeholder
Intel Price Forecast: Nvidia Picked Xeon 6, Invested $5B, Yet Analysts Still Trail INTCIntel Corporation (NASDAQ: INTC) sits at $140.05, holding firm on the ascending trendline within the 2H timeframe. The RSI indicator is currently reading 55.21, positioning it as neutral-
Author  TradingKey
Jul 02, Thu
Intel Corporation (NASDAQ: INTC) sits at $140.05, holding firm on the ascending trendline within the 2H timeframe. The RSI indicator is currently reading 55.21, positioning it as neutral-
placeholder
NVIDIA Price Forecast: Michael Burry Shorts NVDA, but Analysts See $299On July 1, NVIDIA (NASDAQ: NVDA) sits at $198.34, failing to break above the former support level that is now serving as resistance between $198 and $205 on the 2H chart's downward blue c
Author  TradingKey
Jul 02, Thu
On July 1, NVIDIA (NASDAQ: NVDA) sits at $198.34, failing to break above the former support level that is now serving as resistance between $198 and $205 on the 2H chart's downward blue c
placeholder
Meta Compute Launch Sends AI Compute Stocks Tumbling GloballyMeta’s plan to sell surplus computing power hit chip stocks hard on Wall Street. Meta’s own shares climbed nearly 9% on the news.The announcement flipped years of assumed AI compute scarcity into a su
Author  Beincrypto
Jul 02, Thu
Meta’s plan to sell surplus computing power hit chip stocks hard on Wall Street. Meta’s own shares climbed nearly 9% on the news.The announcement flipped years of assumed AI compute scarcity into a su
placeholder
Today’s Market Recap: Chip Stocks Retreat Collectively, Meta Rises Against the Trend, Non-Farm Payrolls Become the Next Key CatalystOn July 1, Eastern Time, U.S. stocks closed fluctuating lower on the first trading day of the second half of the year. Although some megacap tech stocks such as Meta (
Author  TradingKey
Jul 02, Thu
On July 1, Eastern Time, U.S. stocks closed fluctuating lower on the first trading day of the second half of the year. Although some megacap tech stocks such as Meta (
Live Quotes
Name / SymbolChart% Change / Price
SPCX
SPCX
0.00%0.00
TSLA
TSLA
0.00%0.00

US stocks Related Articles

  • Best Oil Stocks to Buy in 2026: Comprehensive Guide & Top Picks
  • Is Anthropic Stock Worth the Hype? What Investors Are Actually Buying and 2026 Valuation Scenarios
  • Best Semiconductor Stocks in 2026: Top 10 Stocks to Watch
  • Guide to Invest in AI Stock 2026 in the UAE: The Best 10 AI Stocks
  • CoreWeave Stock Analysis: Is CRWV a Buy or Sell?
  • SK Hynix Stock Analysis: Will the AI Giant Keep Surging After Its Historic Nasdaq ADR Listing?

Click to view more