


Ripple Price Forecast: XRP slips below $1.30 as sellers tighten grip
- XRP corrects and trades below $1.30 amid persistent drawdowns in the broader cryptocurrency market.
- Retail demand picks up pace, with perpetual futures open interest rising to 2.21 billion XRP amid muted spot ETF activity.
- XRP trades within a weak technical structure defined by overhead moving averages and the SuperTrend line.
Ripple (XRP) hovers below $1.30 on Tuesday, held down by a weakening technical structure. The broader crypto market remains bearish ahead of the Federal Reserve’s (Fed) October 28 monetary decision. Last week's Consumer Price Index (CPI) report confirmed that inflation in the United States (US) remains elevated, casting doubt on the higher-probability view that the central bank will leave interest rates unchanged in the 3.75-4.00% range.
Only 17% of interest rate traders expect the Fed to raise rates by 25 basis points, but that figure is much higher for a December rate hike.
“Markets currently assign approximately an 85% probability to unchanged rates at the 28 October meeting, although expectations for another rate hike in December remain elevated,” Crypto Finance said in an emailed analysis.
XRP derivatives rise amid fading ETF demand
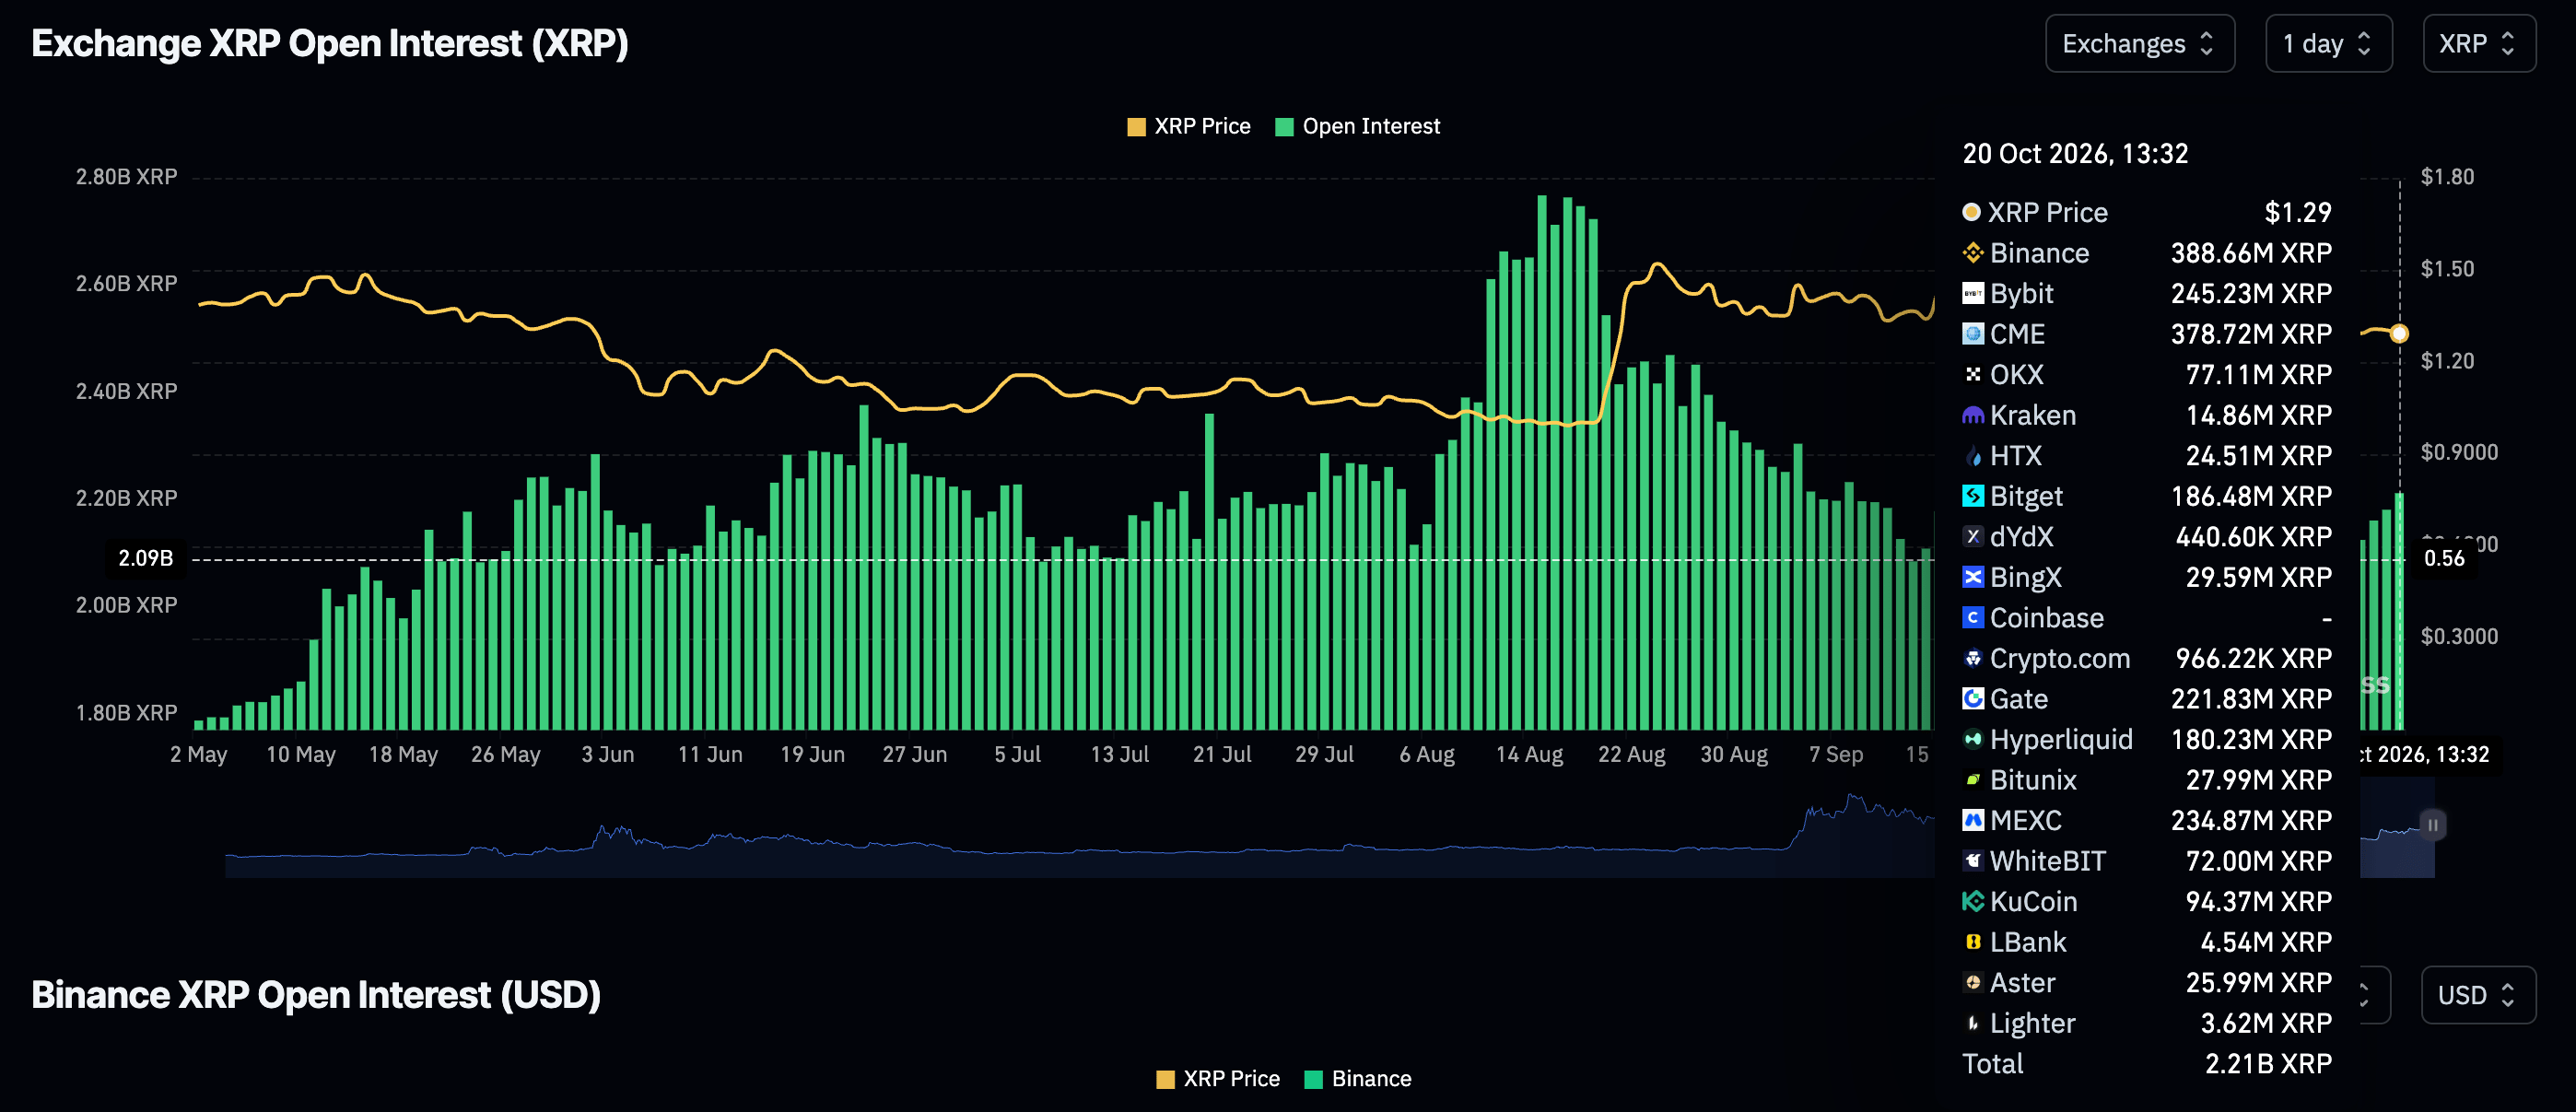
Investor activity remains generally low, as traders reassess their positioning ahead of the Fed decision. The derivatives market reflects a minor increase in retail demand, with perpetual futures Open Interest (OI) averaging 2.21 billion XRP on Tuesday, up from 2.16 billion XRP the day before.
OI has improved from October lows of 2.12 billion XRP but remains well below September highs of 2.46 billion XRP and August highs of 2.77 billion XRP.
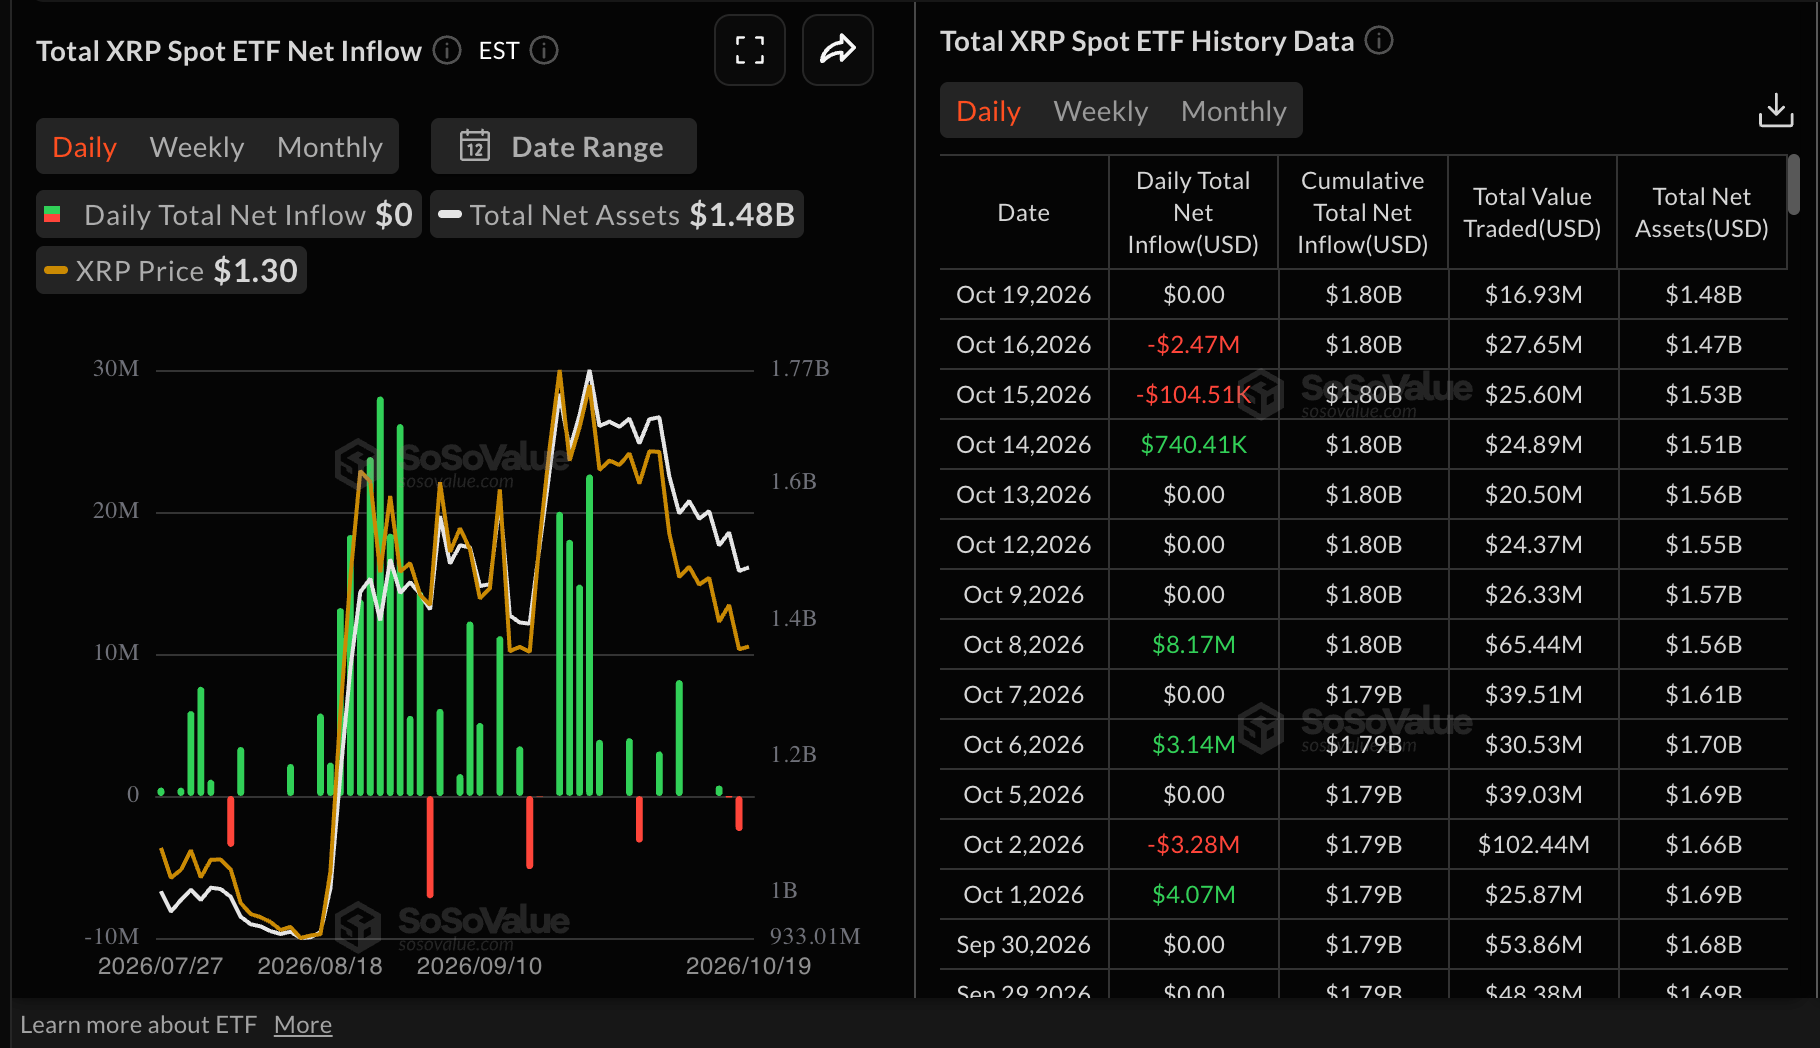
On the institutional front, XRP spot Exchange-Traded Funds (ETFs) experienced outflows of $105,000 on Thursday and $2.5 million on Friday, followed by subdued activity on Monday. Nonetheless, the long-term trajectory remains constructive, supported by cumulative inflows of $1.8 billion and net assets totaling $1.5 billion, according to SoSoValue.
Technical analysis: XRP at risk of deeper losses
XRP trades trades at below $1.30, extending its retreat below all major Exponential Moving Averages (EMAs) and keeping the near-term bias bearish. Price remains below the 100-day EMA at $1.34, as well as the 50-day and 200-day EMAs clustered around $1.38, suggesting recent rebounds are being capped by layered trend resistance.
Momentum stays fragile, with the Relative Strength Index (RSI) at 35 hovering just above oversold territory and the Moving Average Convergence Divergence (MACD) in negative territory, hinting that downside pressure persists despite some slowing in the sell-off.
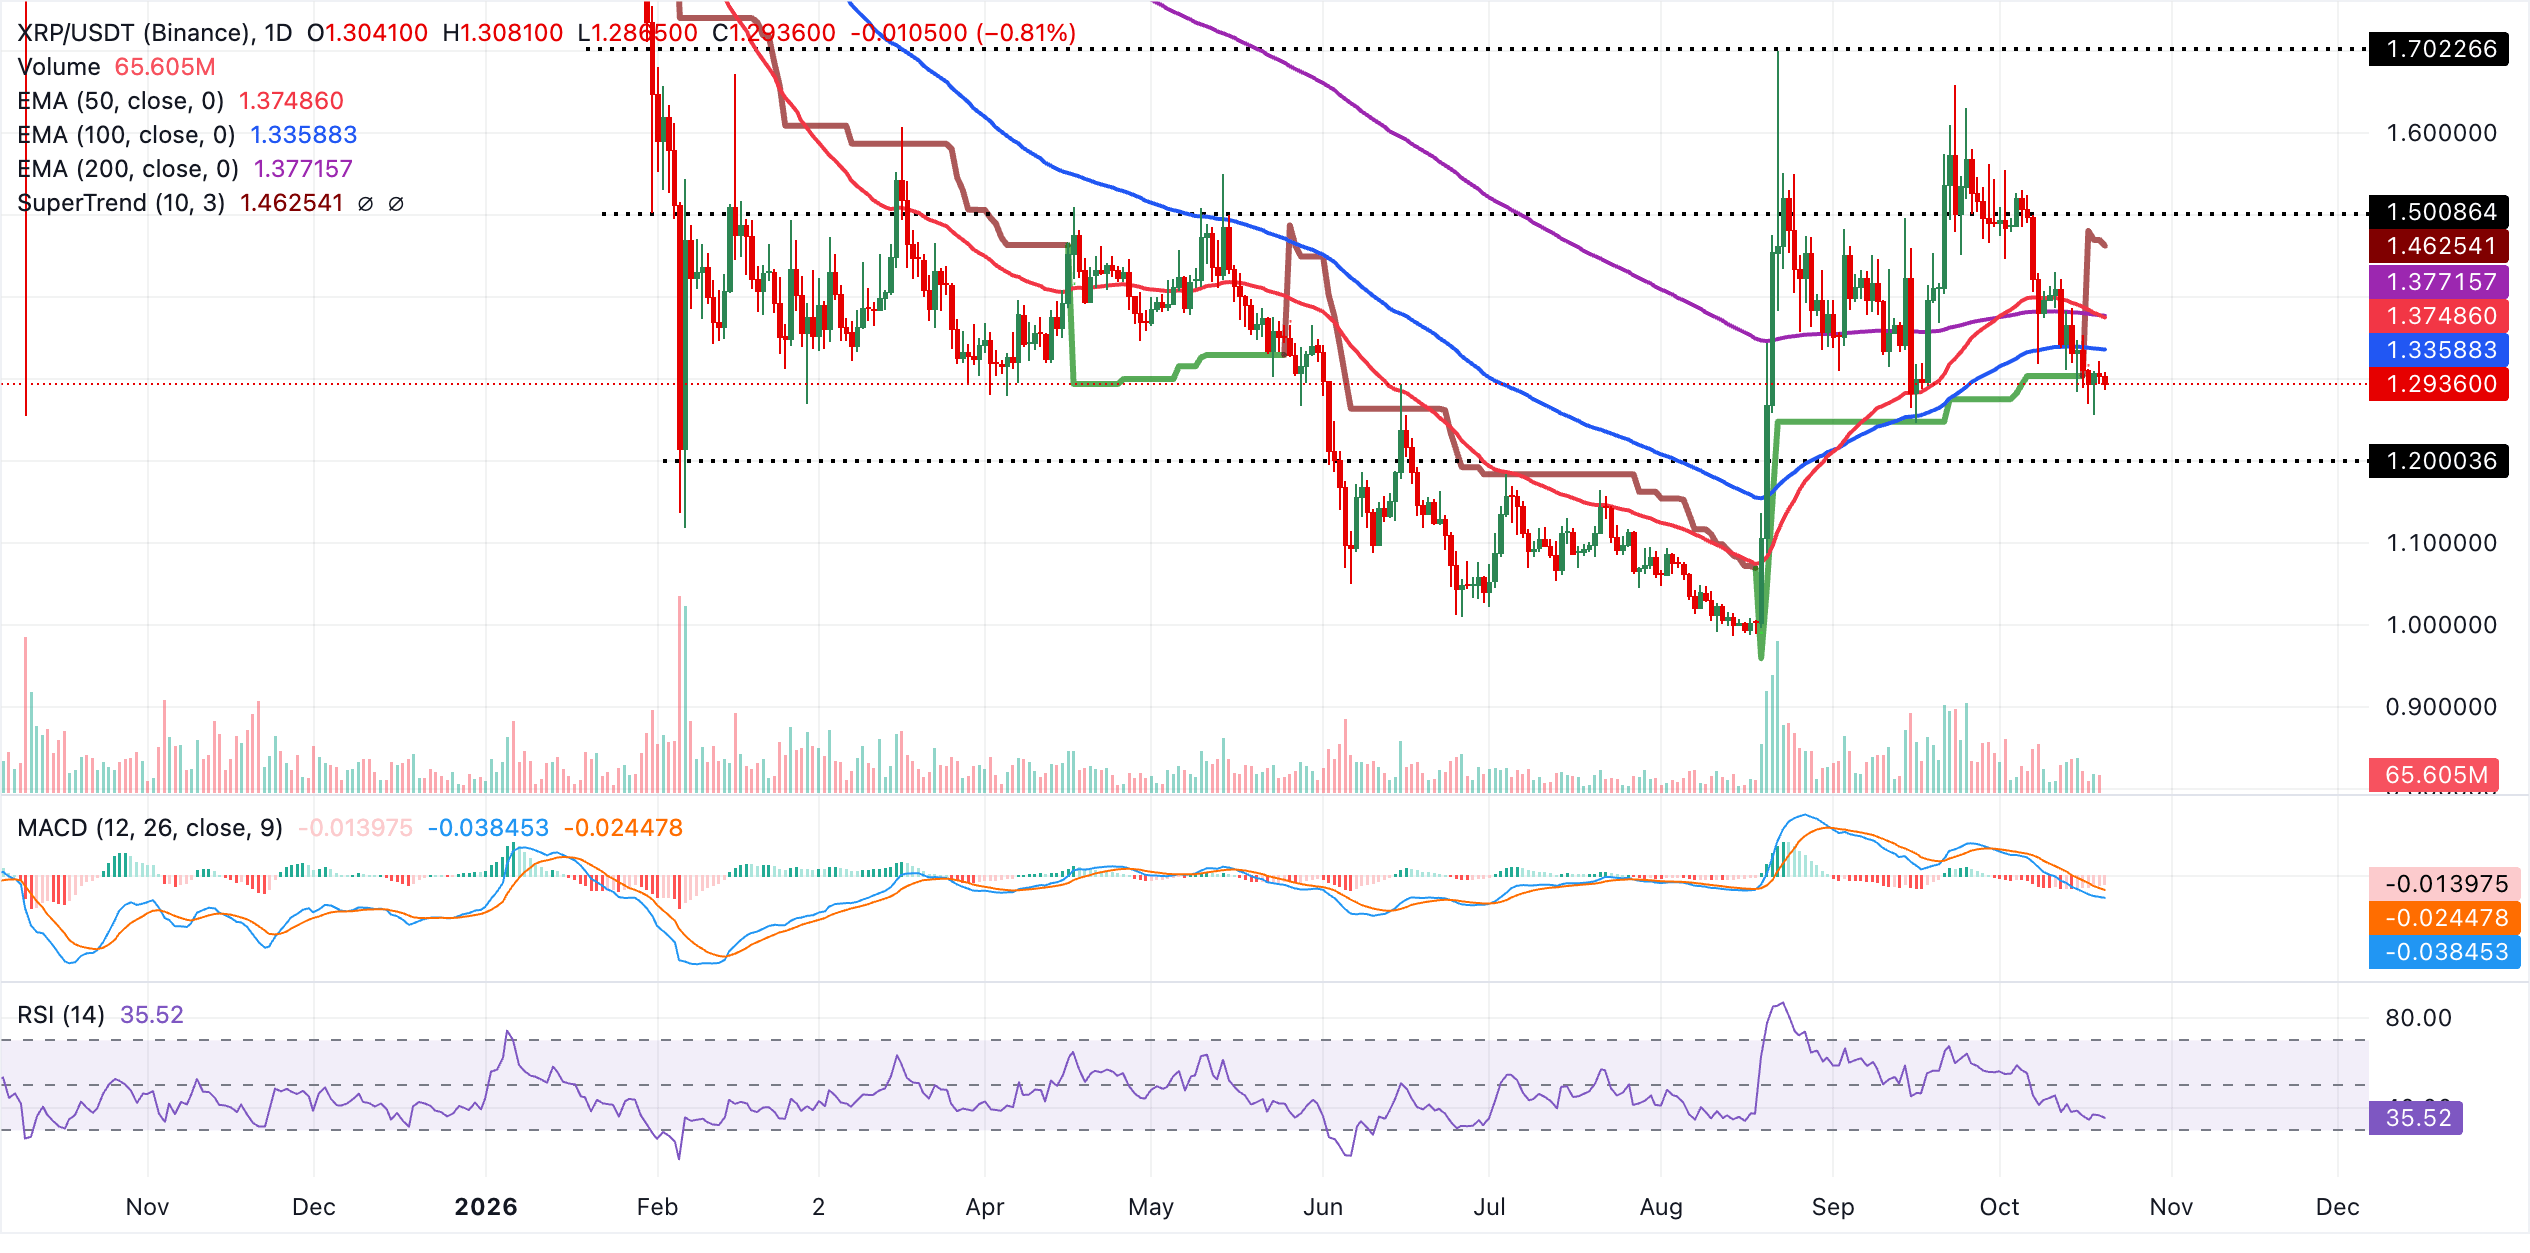
Initial resistance lies at the 100-day EMA at $1.34, with a denser barrier forming in the $1.38 region defined by the 50-day and 200-day EMAs. Above these, the SuperTrend line at $1.46 acts as a higher recovery target that would need to be reclaimed to ease the broader bearish structure. With no clear structural support levels below $1.30 in the current indicator set, the pair remains vulnerable to further downside until buyers push price back above the clustered daily EMAs.
(The technical analysis of this story was written with the help of an AI tool. Know more.)
Crypto ETF FAQs
An Exchange-Traded Fund (ETF) is an investment vehicle or an index that tracks the price of an underlying asset. ETFs can not only track a single asset, but a group of assets and sectors. For example, a Bitcoin ETF tracks Bitcoin’s price. ETF is a tool used by investors to gain exposure to a certain asset.
Yes. The first Bitcoin futures ETF in the US was approved by the US Securities & Exchange Commission in October 2021. A total of seven Bitcoin futures ETFs have been approved, with more than 20 still waiting for the regulator’s permission. The SEC says that the cryptocurrency industry is new and subject to manipulation, which is why it has been delaying crypto-related futures ETFs for the last few years.
Yes. The SEC approved in January 2024 the listing and trading of several Bitcoin spot Exchange-Traded Funds, opening the door to institutional capital and mainstream investors to trade the main crypto currency. The decision was hailed by the industry as a game changer.
The main advantage of crypto ETFs is the possibility of gaining exposure to a cryptocurrency without ownership, reducing the risk and cost of holding the asset. Other pros are a lower learning curve and higher security for investors since ETFs take charge of securing the underlying asset holdings. As for the main drawbacks, the main one is that as an investor you can’t have direct ownership of the asset, or, as they say in crypto, “not your keys, not your coins.” Other disadvantages are higher costs associated with holding crypto since ETFs charge fees for active management. Finally, even though investing in ETFs reduces the risk of holding an asset, price swings in the underlying cryptocurrency are likely to be reflected in the investment vehicle too.
Recommended Articles


