


Chainlink Price Forecast: LINK regains strength on ETF inflows, whale demand
- Chainlink hovers above $13 on Monday, sustaining the mild recovery seen over the last three days.
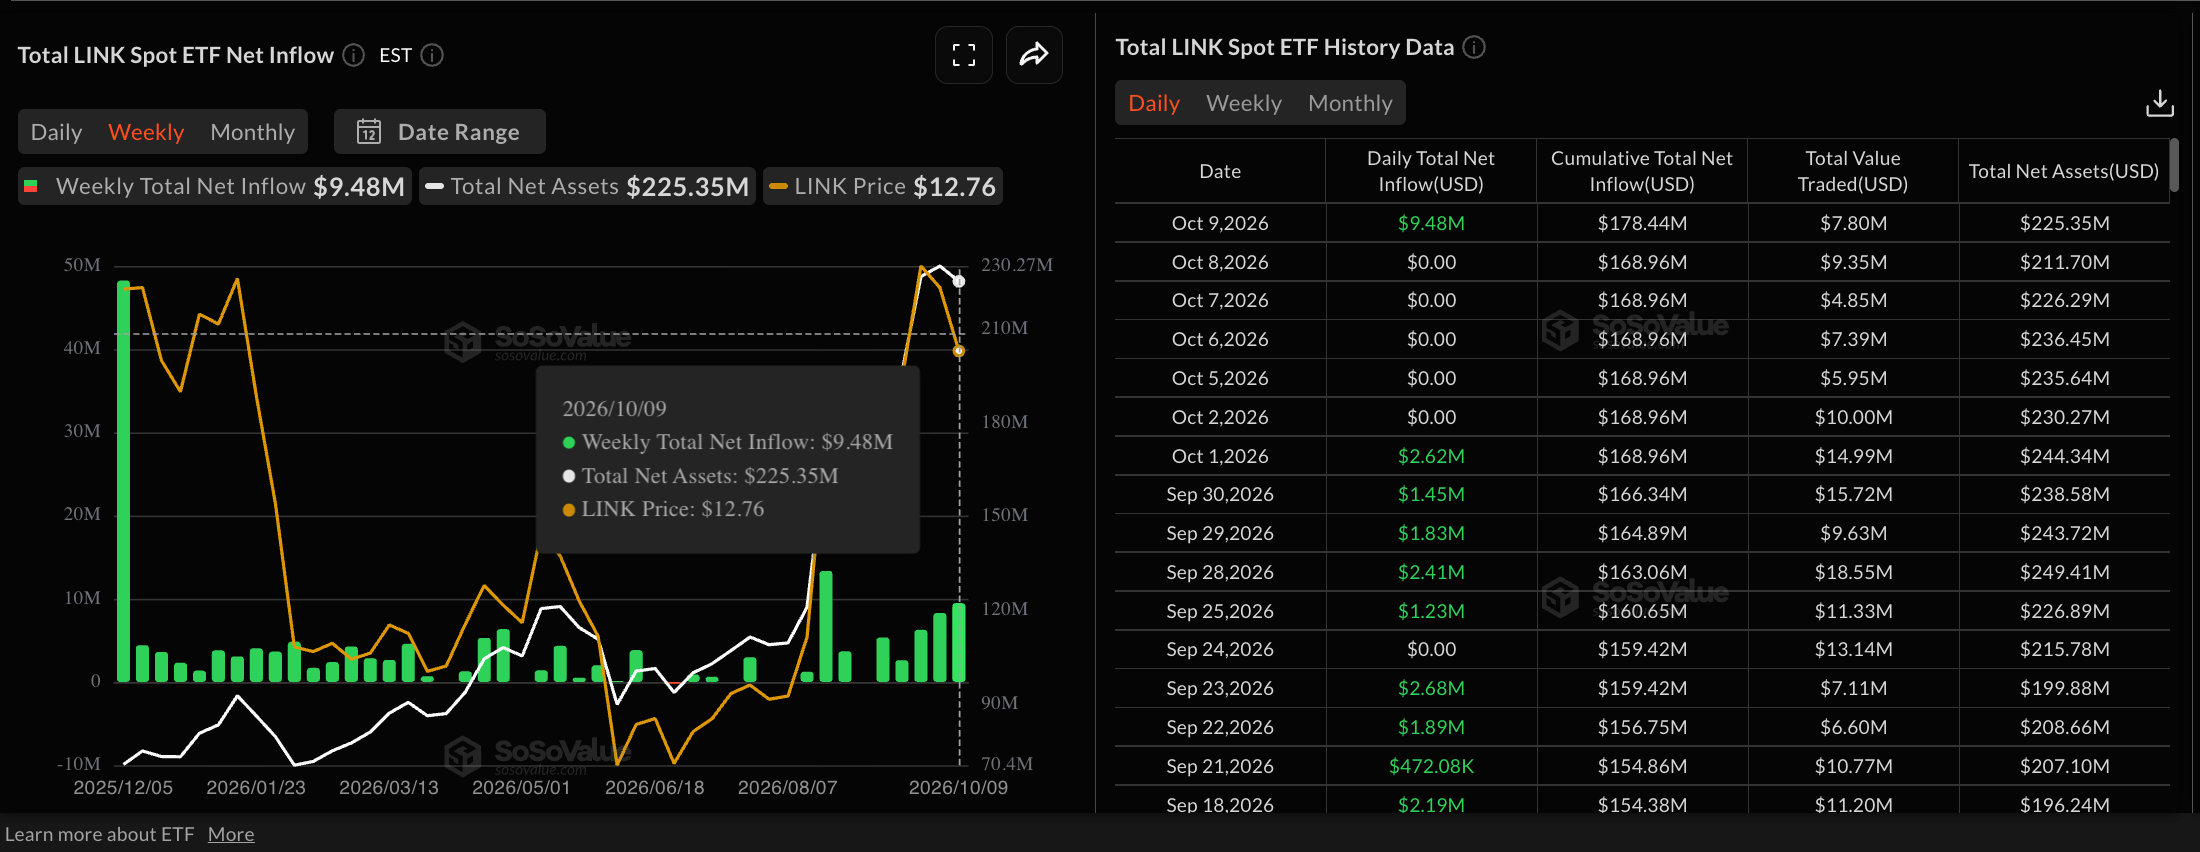
- LINK-focused ETFs recorded over $9 million in inflows last week, marking their largest daily inflow so far this year.
- On-chain data shows a steady increase in demand from large-wallet investors, suggesting further upside potential.
Chainlink (LINK) price is trading above $13.00 at press time on Monday, maintaining a steady recovery from Thursday’s low at $12.09. The oracle token is gaining institutional demand, with over $9 million in inflows on Friday and growing holdings by large-wallet investors, commonly referred to as whales. The technical outlook for LINK suggests an upside bias as buyers test a bullish breakout of a near-term resistance trendline.
ETF inflows and whale demand back LINK’s long-term potential
Chainlink is gaining institutional confidence with five consecutive weeks of inflows. SoSoValue data shows LINK-focused Exchange Traded Funds (ETFs) recorded $9.48 million in inflows on Friday, the largest so far this year. Consistent inflows reflect firm demand for the oracle token among traditional investors.
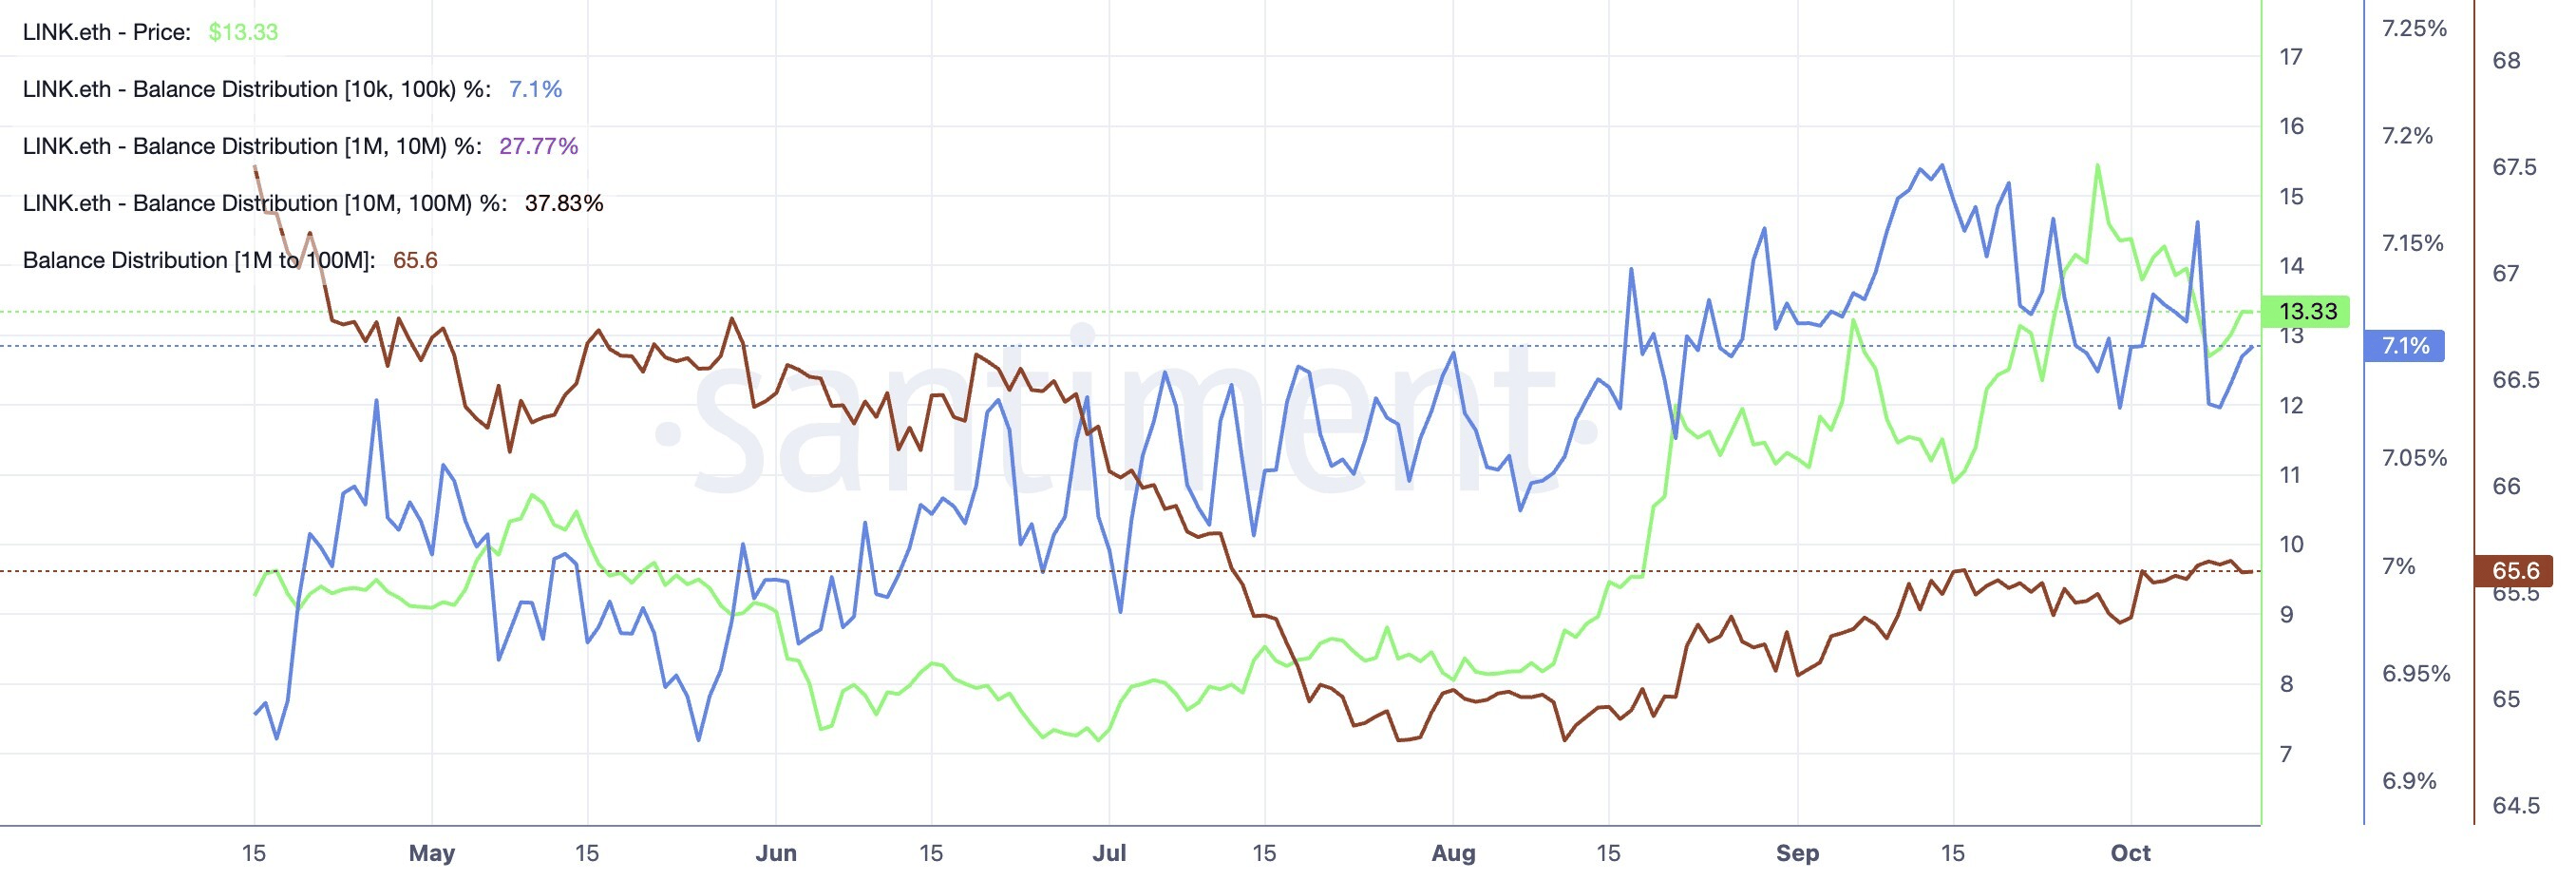
On the other hand, on-chain data shows a steady increase in holdings by large-wallet investors. According to Santiment, holders with 1 million to 100 million LINK tokens now account for 65.6% of the circulating supply, up from 65.38% on October 1. This increase in exposure reflects long-term support for the token.
Technical outlook: Chainlink recovery aims for a higher leg formation
Chainlink price hovers around $13.34 at press time on Monday, holding a long-term constructive tone. LINK shows a rebound off a rising support trendline that connects the August 10 and September 16 lows near $12.30. However, LINK also shows a near-term corrective pullback from the September 29 high of around $15.77.
Chainlink hovers above the declining 50-period Exponential Moving Average (EMA) around $13.32, testing the bullish breakout of the overhead trendline near $13.50 that connects the September 30 and October 5 highs.
A confirmed breakout above the trendline near $13.50 could target the 50% retracement of the downswing from the September 29 high at $15.77 to Thursday's low at $12.09, which is $13.93. A sustained recovery could target the $15.77 swing high, followed by the 127.2% Fibonacci extension level at $16.77.
Momentum is now pushing higher on the four-hour chart, with the Moving Average Convergence Divergence (MACD) in positive territory and the Relative Strength Index (RSI) hovering around 57, together suggesting building bullish momentum.
On the downside, immediate support is provided by the 50-period EMA at $13.32, with further cushions at the 200-period EMA at $12.95. Below these, the prior rising trendline break area around $12.30 and the $12.09 swing low mark deeper structural support.
(The technical analysis of this story was written with the help of an AI tool. Know more.)
Recommended Articles


