


Gold declines as US-Iran escalation drives Oil prices, global bond yields higher
- Gold remains under pressure as rising global bond yields and a stronger US Dollar weigh on the yellow metal.
- Escalating tensions in the Middle East lift Oil prices, complicating the inflation outlook for major central banks.
- Sellers retain control below the 100-day SMA, with the lower Bollinger Band offering initial support.
Gold (XAU/USD) remains on the defensive on Wednesday after tumbling nearly 2.7% the previous day. The resumption of hostilities in the Middle East after several quieter weeks is once again dominating market sentiment, driving Oil prices and global bond yields higher while strengthening the US Dollar (USD). At the time of writing, XAU/USD trades around $4,310 after hitting an intraday low of $4,282, its lowest level since August 7.
Bond yields have climbed to multi-year highs across major economies as rising Oil prices threaten to keep inflation elevated for longer. This could force central banks to maintain restrictive monetary policy or even consider raising interest rates. The benchmark 10-year US Treasury yield advances for the sixth consecutive day and trades around 4.81%, its highest level since October 2023.
Rising yields and expectations of higher interest rates are weighing heavily on the non-yielding metal, outweighing the support Gold would normally receive from heightened inflation and geopolitical tensions given its traditional role as a hedge against both risks.
On the monetary policy front, traders have increased bets that the Federal Reserve (Fed) could raise interest rates as soon as September, particularly after Fed Chair Kevin Warsh adopted a tougher stance on inflation at the Jackson Hole Symposium last week. According to the CME FedWatch tool, the probability of a rate hike at the September 15-16 meeting stands at around 70%, up from 36% a week ago.
Hawkish Fed expectations and escalating US-Iran tensions have also increased demand for the US Dollar, adding another headwind for the Dollar-denominated Gold. The US Dollar Index (DXY), which tracks the Greenback’s value against a basket of six major currencies, trades around 99.85, its highest level since August 14.
Against this backdrop, Gold is likely to retain a downside bias, although sellers could refrain from placing aggressive bets ahead of US labour market data. The ADP Employment Change report is due later during American trading hours, followed by the Nonfarm Payrolls (NFP) report on Friday. The figures could influence Fed interest-rate expectations and drive fresh moves in the US Dollar, Treasury yields and, in turn, Gold.
Technical analysis: Bears eye $4,200 as RSI slips below 50
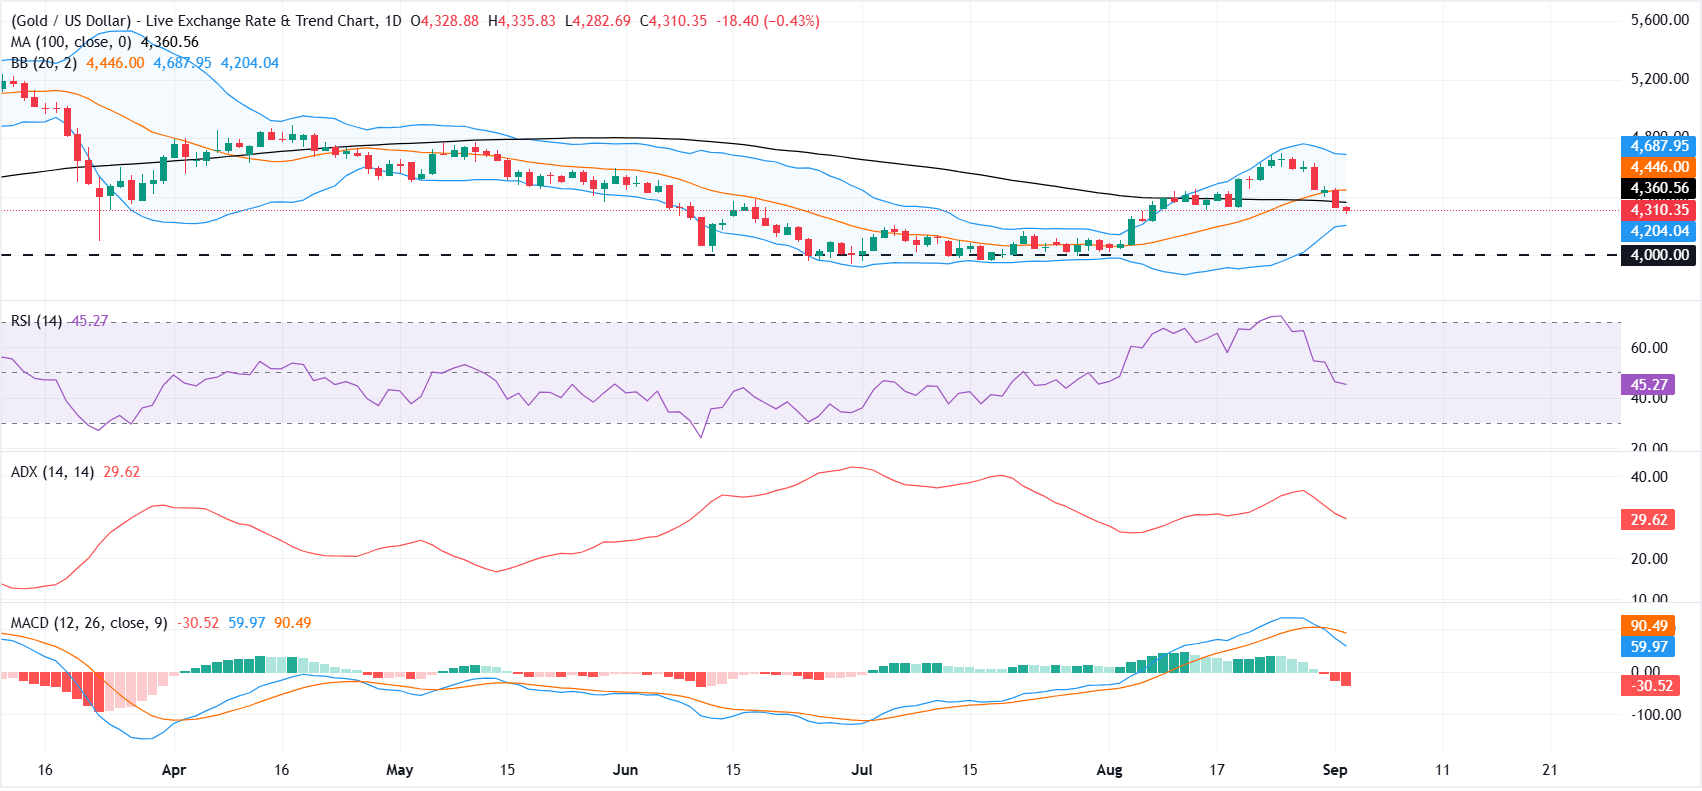
XAU/USD holds below the 100-day Simple Moving Average (SMA) at roughly $4,360 and the Bollinger Bands midline near $4,445, keeping the near-term bias tilted lower. Momentum gauges reinforce this capped tone, with the Relative Strength Index (RSI) on the daily chart hovering just below the neutral 50 line at 45, while the Moving Average Convergence Divergence (MACD) histogram sits in negative territory, signaling increasing bearish pressure.
On the downside, immediate support is aligned with the Bollinger Bands lower band at about $4,204, ahead of a more substantial horizontal floor at $4,000. On the topside, initial resistance emerges at the 100-day SMA near $4,360, followed by the Bollinger Bands midline around $4,446, with the upper band near $4,688 acting as a more distant cap.
(The technical analysis of this story was written with the help of an AI tool. Know more.)
Recommended Articles


