


Silver Price Forecast: Silver Nears $70, Next Target Eyed at $90
TradingKey - As of the Asian session on August 25, silver prices (XAGUSD) were consolidating below $70, reaching an intraday high of $69.94 and briefly approaching the $70 mark before coming under pressure and pulling back, with the latest price trading around $68.20. Last week, silver prices rose 6.56%, and have accumulated a gain of over 18% over the past month, indicating that silver's bullish momentum has strengthened significantly amid the broader recovery in the precious metals market.
Weaker Dollar and Stronger Gold Support Silver Price Rise
From a fundamental perspective, the primary driver behind the recent rise in silver prices lies in changes in the US dollar and US interest rate expectations.
After the US Treasury expanded long-term Treasury buybacks, pressure on the US Treasury market eased, causing the US dollar to continuously weaken. As gold (XAUUSD) and silver are both denominated in US dollars, a falling dollar reduces purchasing costs for non-dollar investors and drives capital back into precious metal assets like gold and silver. Today, gold briefly rose to $4,696.82 intraday, hitting a near three-month high, as overall market risk appetite for precious metals improved noticeably.
Following gold's sustained breakthrough above $4,600, the relative valuation gap between gold and silver has drawn some capital toward silver. Spot silver has now risen near a two-month high and is beginning to test the key psychological level of $70.
Over a longer horizon, silver fundamentals remain supported by tight supply. In recent years, silver has faced an ongoing imbalance between limited mine supply growth and elevated industrial demand, with the solar, electrification, and electronics sectors serving as key sources of demand. However, high silver prices are also exerting a demand-suppression effect; in particular, the solar industry may manage costs by reducing silver consumption per unit or seeking alternative materials, which will limit the long-term elasticity of silver demand.
Looking ahead, the silver market's primary focus will remain on US economic data and Federal Reserve policy signals. This week, the market will closely monitor US PCE inflation data and Fed Chair Kevin Warsh's speech at Jackson Hole. If inflation continues to cool and market expectations for Fed rate hikes further diminish, the US dollar and Treasury yields could remain under pressure, benefiting both gold and silver. Conversely, if Warsh continues to emphasize inflation risks and keeps the door open for rate hikes, a rebound in the US dollar could trigger a pullback in silver from its recent highs.
Silver Price Technical Analysis
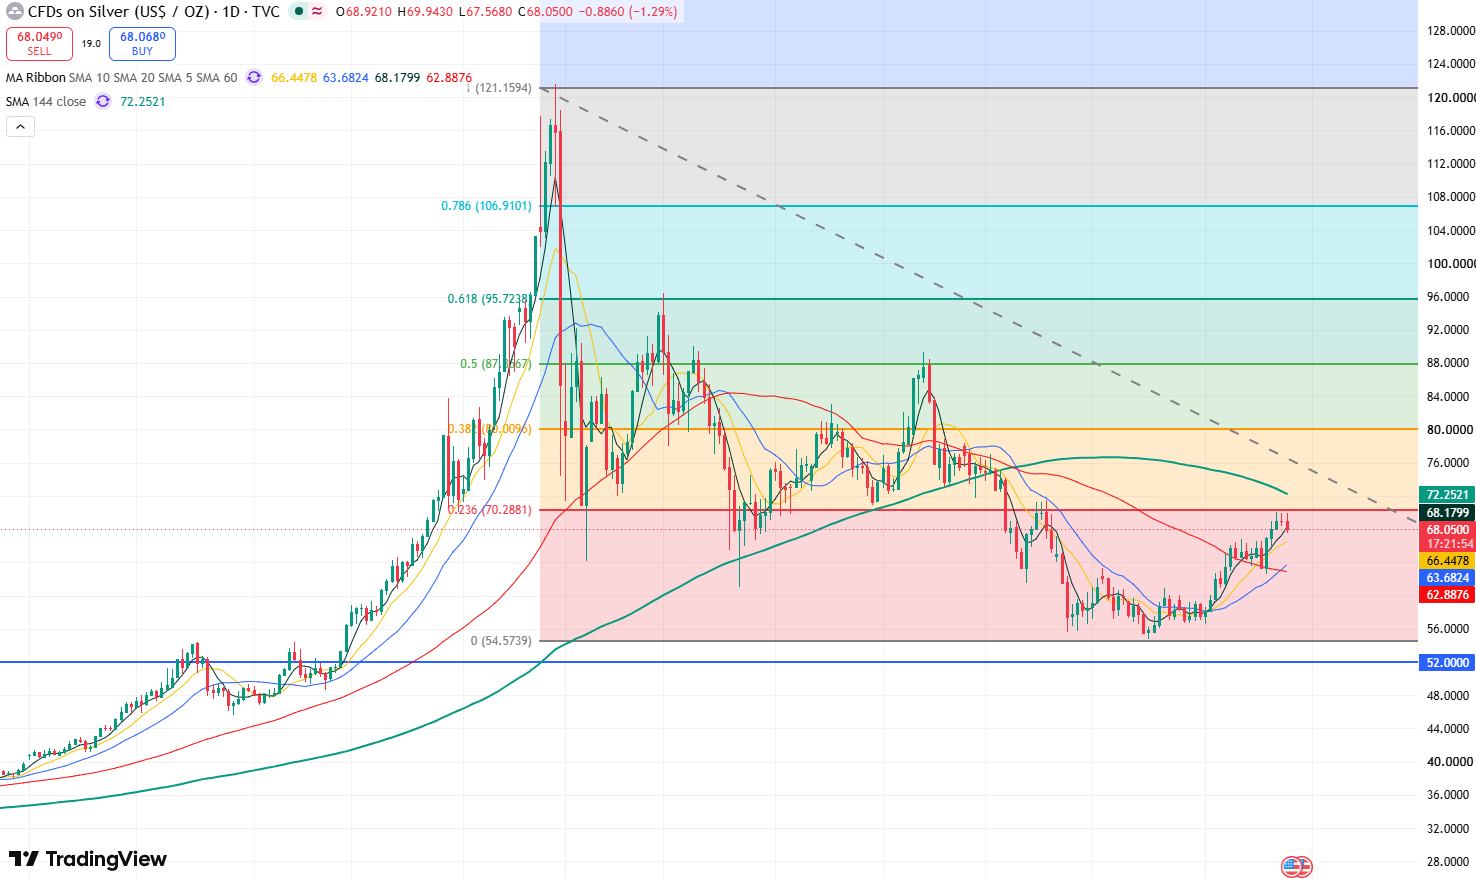
Silver price daily chart, Source: TradingView
On the daily chart, silver prices have continued to rebound recently from near $55 to just below $70, accumulating a gain of over 18% over the past month. The overall price range has clearly shifted upward, and bullish market sentiment has improved significantly.
Currently, silver prices have tested the key $70 level to the upside for three consecutive trading days without a breakout, indicating strong resistance at this level and a growing likelihood of a short-term pullback.
On the downside, the primary support level to watch is around $66.5. If silver prices fall below this level, they may further test support at the 20-day moving average. If the 20-day moving average is breached, silver prices could pull back toward the $60 mark.
On the upside, silver prices currently face major resistance at the key $70 mark. If prices break out and hold above $70, further upside space will open up, with the potential to test the $80 mark. Continuing upward, silver prices could potentially rise to around $88-$90.
Recommended Articles


