


NZD/USD Price Forecast: At fresh yearly lows with bears pushing against 0.5600
- NZD/USD tests support at 0.5600 after dropping about 6% over the last six weeks.
- Risk aversion, rising Oil prices, and higher US yields are hammering the Kiwi this week.
- Technical indicators suggest that the bearish cycle is overstretched
The New Zealand Dollar (NZD) keeps depreciating against the US Dollar (USD) on Thursday, hammered by a perfect storm of risk aversion, high Oil prices, and escalating US Treasury yields that have boosted the Greenback across the board. Against this background, the NZD/USD pair has hit fresh year-to-date (YTD) lows at 0.5599 on Thursday, after dropping nearly 6% in a six-week selloff.
The yield for the benchmark 10-year note has reached fresh 24-year highs above 5.30% on Thursday as the stalled Middle East conflict keeps boosting global inflation via energy prices. The yield of the 30-year bond hit 5.65%, also its highest level since May 2002, while the two-year yield remains steady at 4.90% despite fading hopes of a Federal Reserve (Fed) rate hike in October.
Beyond that, Crude prices have jumped higher, as the US-Israel war against Iran enters its seventh month. The price of a barrel of Brent Oil wavers around the key $100 level, posing a significant strain for oil-importing countries like New Zealand.
Technical Analysis: Heavily oversold levels warn caution
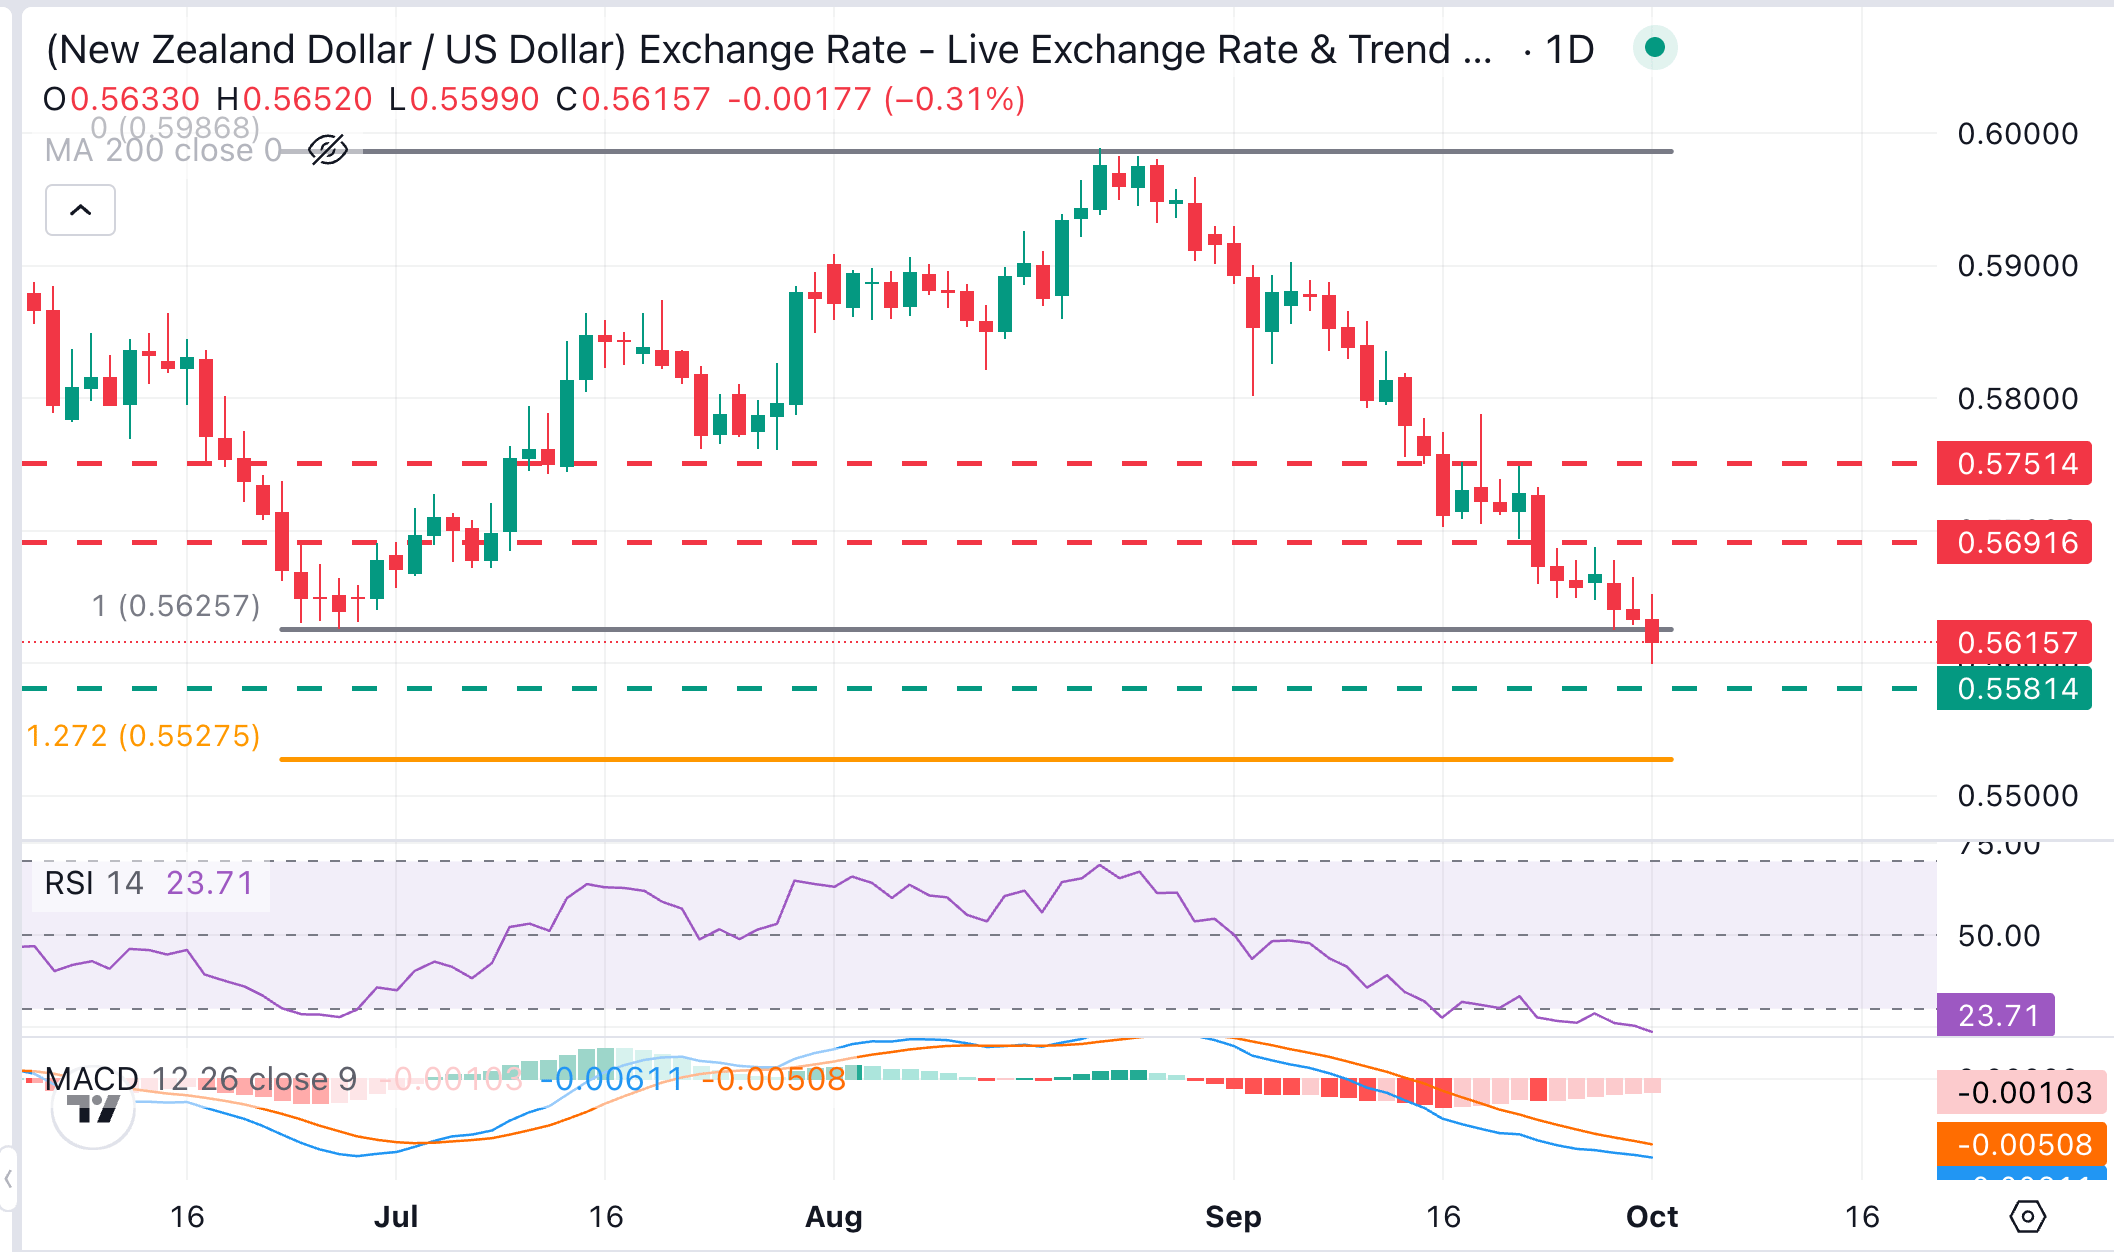
NZD/USD trades at 0.5606, after an extended bearish phase which has pushed the Relative Strength Index (14) to heavily oversold levels in most timeframes. The daily RSI is just above 20, while the Moving Average Convergence Divergence (MACD) line remains well below zero, both at levels that often lead to some correction.
The psychological 0.5600 area is holding bears for now, although upside attempts remain muted, which keeps the November 2025 low at 0.5580 and the 127.2% Fibonacci retracement of the June-August rally at 0.5525 on the bears' focus. A bullish reaction, on the other hand, is likely to be tested at the previous YTD low of 0.5625 ahead of the weekly high, near 0.5690.
(The technical analysis of this story was written with the help of an AI tool. Know more.)
New Zealand Dollar Price This week
The table below shows the percentage change of New Zealand Dollar (NZD) against listed major currencies this week. New Zealand Dollar was the strongest against the Australian Dollar.
| USD | EUR | GBP | JPY | CAD | AUD | NZD | CHF | |
|---|---|---|---|---|---|---|---|---|
| USD | 0.69% | -0.02% | 0.38% | 0.72% | 0.87% | 0.80% | 0.82% | |
| EUR | -0.69% | -0.77% | -0.27% | 0.00% | 0.19% | 0.09% | 0.11% | |
| GBP | 0.02% | 0.77% | 0.31% | 0.74% | 0.92% | 0.82% | 0.84% | |
| JPY | -0.38% | 0.27% | -0.31% | 0.24% | 0.44% | 0.34% | 0.33% | |
| CAD | -0.72% | -0.00% | -0.74% | -0.24% | 0.20% | 0.06% | 0.11% | |
| AUD | -0.87% | -0.19% | -0.92% | -0.44% | -0.20% | -0.10% | -0.08% | |
| NZD | -0.80% | -0.09% | -0.82% | -0.34% | -0.06% | 0.10% | 0.02% | |
| CHF | -0.82% | -0.11% | -0.84% | -0.33% | -0.11% | 0.08% | -0.02% |
The heat map shows percentage changes of major currencies against each other. The base currency is picked from the left column, while the quote currency is picked from the top row. For example, if you pick the New Zealand Dollar from the left column and move along the horizontal line to the US Dollar, the percentage change displayed in the box will represent NZD (base)/USD (quote).
Recommended Articles


