


Bank of Japan is expected to deliver a hawkish hike, pressured by rising inflation
- The Bank of Japan is set to hike interest rates to 1.25%, the highest level in 31 years.
- Higher inflation, strong GDP data and pressure from the US administration are pushing the BoJ to step up its tightening pace.
- The US Dollar has pared some losses this week, fuelled by the Fed’s hawkish monetary policy stance.
The Bank of Japan’s (BoJ) monetary policy meeting will close a week packed with central bank decisions on Friday, with markets particularly interested in confirming expectations of a hawkish shift that has boosted a strong Japanese Yen (JPY) recovery in September.
Futures markets are practically fully pricing a quarter-point rate hike this time, which would push the BoJ’s benchmark interest rate to its highest level in about 31 years, amid higher inflation, rising wages, and pressure from US Treasury Secretary Scott Bessent.
The Japanese central bank will follow the Federal Reserve (Fed) and the European Central Bank (ECB) in tightening monetary policy as the war in the Middle East fuels global inflation. The Strait of Hormuz remains practically closed, and recent developments threaten the Red Sea alternative route, pushing Brent Oil prices above $100 and spurring serious concerns about supply disruptions.
What to expect from the BoJ interest rate decision?
Barring a highly unlikely surprise, the Bank of Japan will raise its benchmark interest rate from 1% to 1.25% on Friday, drawing monetary policy closer to levels the bank considers neutral for the Japanese economy. The decision is likely to obtain the support of the broad majority of the Policy Board, with recently appointed committee member Toichiro Asada likely to dissent, as he did at June’s meeting.
Rising inflationary pressures, among other reasons, have prompted the BoJ to accelerate its monetary tightening pace. So far, the bank has kept a semi-annual hiking pace, while September’s rate increase, if confirmed, would follow a previous one in June. Markets have speculated on a half-point rate hike, but considering the cautious approach to monetary policy of the Japanese central bank, that option seems out of the question.
Japan’s Consumer Price Index (CPI) data from July revealed that prices grew at their fastest pace in the last seven months, reaching 1.9%, just below the BoJ’s 2% target for price stability. Beyond that, wages have continued rising, which hints at stronger price pressures in the near-term, altogether heightening the risk that the central bank might fall behind the inflation curve if it sticks to the gradual tightening path seen hitherto.
Japan’s broader economic outlook remains supportive too. The Gross Domestic Product (GDP) beat expectations in the second quarter, with a 1.4% annualised growth, providing fairly favourable conditions for some monetary tightening.
Against this backdrop, investors are waiting for the bank to deliver a clear message outlining a firmer monetary policy normalisation cycle ahead. This would come after less-than-subtle pressures from the US administration, following an exceptional coordinated intervention between the US and Japan in Forex markets that halted a long-lasting Yen decline in late July.
Analysts at ING, however, warn that the market might be overestimating BoJ’s hawkishness, arguing that Japan’s “aggressive pro-growth strategy” will act as a brake on any rapid shift to tighter policy by the BoJ. They note that the government “will no doubt express its views against a more aggressive tightening cycle,” adding that it is “hard to see government officials backing a much faster tightening cycle of either a 50bp hike in September or back-to-back hikes in September and October.”
How could the Bank of Japan's monetary policy decision affect USD/JPY?
USD/JPY is showing a 2.5% decline in September so far, as a series of hawkish comments by BoJ officials has prompted traders to ramp up bets on a steeper BoJ tightening cycle. This has triggered a massive short covering in Japanese Yen, with large speculators flipping their net positioning to long JPY for the first time since February.
The US Dollar (USD) has managed to regain some ground this week. The Federal Reserve (Fed) provided a fresh boost to the Greenback on Wednesday by hiking interest rates and pointing to further tightening in coming months, but the broader near-term bias remains bearish.
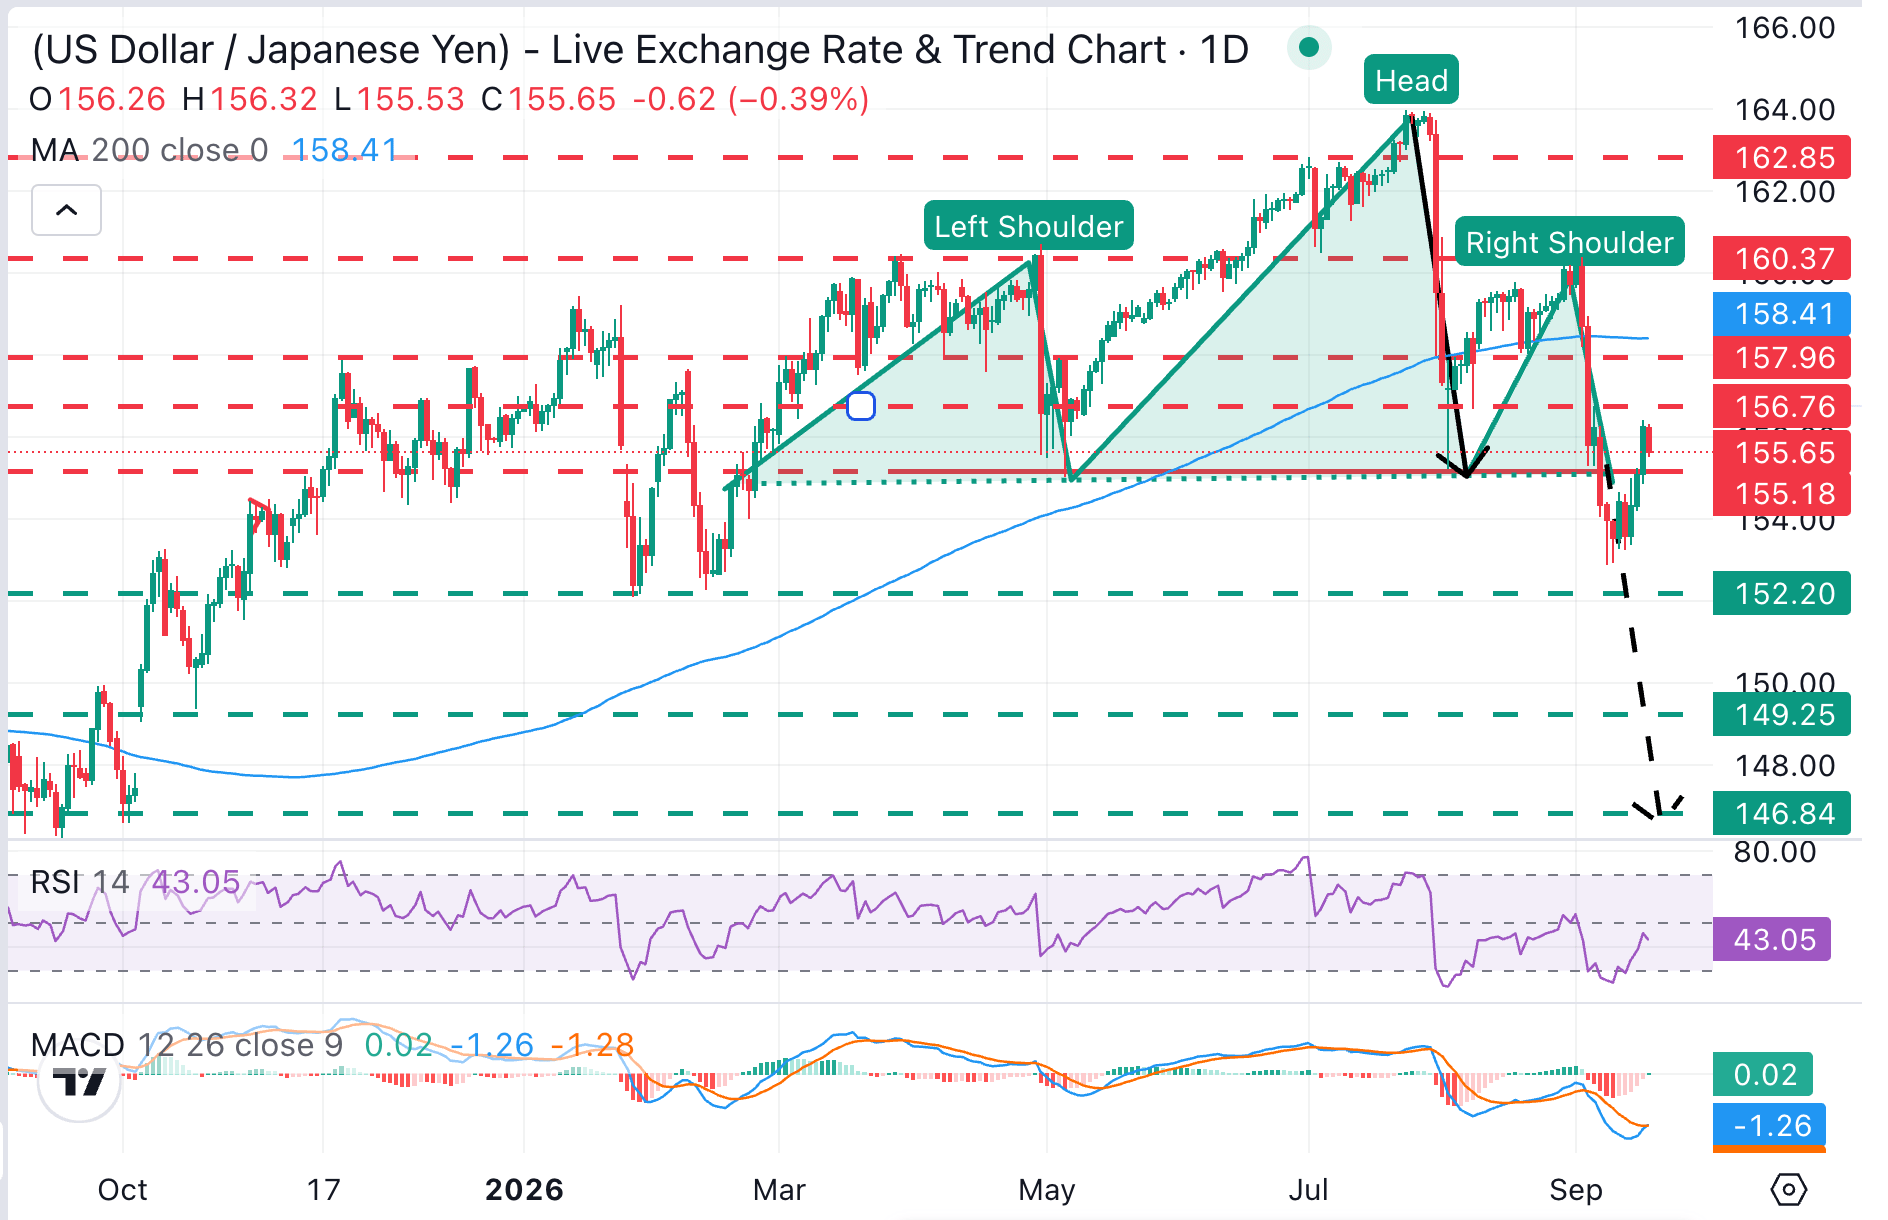
The USD/JPY pair has returned above the neckline of a bearish Head & Shoulders (H&S) pattern, following a post-Fed rally, but is struggling to get past a previous support-turned-resistance at the 156.75 area, which keeps the broader bearish structure in place. Momentum indicators on the daily chart endorse the bearish view, as the Relative Strength Index (RSI) remains below the 50 level and the Moving Average Convergence Divergence (MACD) is below zero, suggesting rallies are likely to find sellers.
Bulls should confirm above the mentioned H&S neckline at 155.20 and the September 4 high at 156.76 to clear the path towards the area between the previous support zone around 158.00 and the 200-day Simple Moving Average (SMA), at 158.41.
A reversal below 155.20, on the contrary, would confirm the H&S formation, adding pressure towards the 2026 lows near 152.00. The H&S’s measured target lies around the October 2025 lows, at 146.60.
Bank of Japan FAQs
The Bank of Japan (BoJ) is the Japanese central bank, which sets monetary policy in the country. Its mandate is to issue banknotes and carry out currency and monetary control to ensure price stability, which means an inflation target of around 2%.
The Bank of Japan embarked in an ultra-loose monetary policy in 2013 in order to stimulate the economy and fuel inflation amid a low-inflationary environment. The bank’s policy is based on Quantitative and Qualitative Easing (QQE), or printing notes to buy assets such as government or corporate bonds to provide liquidity. In 2016, the bank doubled down on its strategy and further loosened policy by first introducing negative interest rates and then directly controlling the yield of its 10-year government bonds. In March 2024, the BoJ lifted interest rates, effectively retreating from the ultra-loose monetary policy stance.
The Bank’s massive stimulus caused the Yen to depreciate against its main currency peers. This process exacerbated in 2022 and 2023 due to an increasing policy divergence between the Bank of Japan and other main central banks, which opted to increase interest rates sharply to fight decades-high levels of inflation. The BoJ’s policy led to a widening differential with other currencies, dragging down the value of the Yen. This trend partly reversed in 2024, when the BoJ decided to abandon its ultra-loose policy stance.
A weaker Yen and the spike in global energy prices led to an increase in Japanese inflation, which exceeded the BoJ’s 2% target. The prospect of rising salaries in the country – a key element fuelling inflation – also contributed to the move.
Economic Indicator
BoJ Interest Rate Decision
The Bank of Japan (BoJ) announces its interest rate decision after each of the Bank’s eight scheduled annual meetings. Generally, if the BoJ is hawkish about the inflationary outlook of the economy and raises interest rates it is bullish for the Japanese Yen (JPY). Likewise, if the BoJ has a dovish view on the Japanese economy and keeps interest rates unchanged, or cuts them, it is usually bearish for JPY.
Read more.Next release: Fri Sep 18, 2026 03:00
Frequency: Irregular
Consensus: 1.25%
Previous: 1%
Source: Bank of Japan
Recommended Articles


