


USD/JPY Price Forecast: 20-day acts key barrier near 156.45
- USD/JPY falls to near 155.80 as the Japanese Yen trades higher.
- The BoJ is expected to raise interest rate by 25 bps to 1.25% on Friday.
- The Fed is expected to deliver more interest rate hikes this year.
The Japanese Yen (JPY) outperforms its major currency peers on Thursday, with the USD/JPY trading 0.28% lower to near 155.80. The Asia-Pacific currency gains on expectations that the Bank of Japan (BoJ) will remain on the monetary tightening path even after raising interest rates by 25 basis points (bps) to 1.25% on Friday.
Danske Bank sees BoJ hiking and signalling nimbler tightening
Analysts at Danske Bank expect the BoJ to deliver a further rate increase, stating that “we expect the Bank of Japan to hike its policy rate to 1.25%.” They note that “the move has largely been priced in by investors as market pricing has tightened significantly during recent weeks” and add that they “do not expect Governor Ueda to push against that.”
Looking beyond the decision itself, Danske Bank anticipates a shift in the communication around the policy path, saying “we expect BoJ will signal a nimbler approach to the tightening pace than the very cautious hiking cycle we have witnessed so far.” In their view, “anything else will weigh heavy on the yen,” underscoring the currency’s sensitivity to how the central bank frames its next steps.
Meanwhile, the US Dollar corrects after failing to extend its three-day winning streak. On the monetary policy front, the Federal Reserve (Fed) signaled in the policy meeting on Wednesday that more interest rate hikes are likely this year.
The Fed’s dot plot showed that 16 of 18 members see atleast one more interest rate hike this year.
USD/JPY Technical Analysis
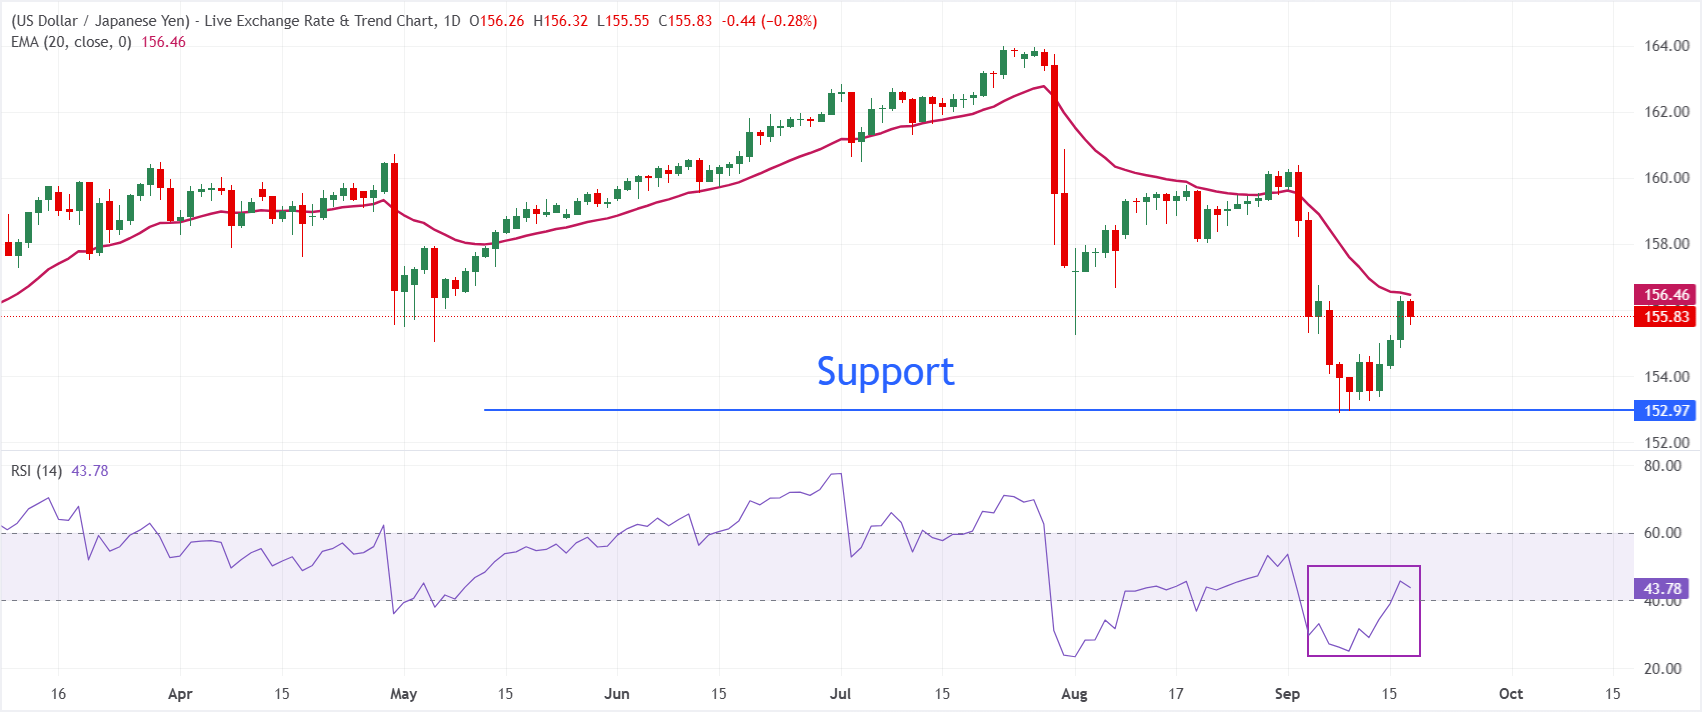
In the daily chart, USD/JPY trades at 155.83, maintaining a bearish near-term bias as spot holds beneath the 20-day exponential moving average (EMA) at 156.46. The pair has failed to reclaim this short-term trend barrier, keeping price action capped despite a modest recovery in the Relative Strength Index (RSI), which has bounced from oversold territory toward a more neutral 43.79, hinting at cooling downside pressure rather than a clear reversal.
On the topside, immediate resistance is located at the 20-day EMA at 156.46, which acts as the first hurdle for any corrective bounce. Looking down, the September 8 low at 152.89 is the key support level.
(The technical analysis of this story was written with the help of an AI tool. Know more.)
Economic Indicator
BoJ Interest Rate Decision
The Bank of Japan (BoJ) announces its interest rate decision after each of the Bank’s eight scheduled annual meetings. Generally, if the BoJ is hawkish about the inflationary outlook of the economy and raises interest rates it is bullish for the Japanese Yen (JPY). Likewise, if the BoJ has a dovish view on the Japanese economy and keeps interest rates unchanged, or cuts them, it is usually bearish for JPY.
Read more.Next release: Fri Sep 18, 2026 03:00
Frequency: Irregular
Consensus: 1.25%
Previous: 1%
Source: Bank of Japan
Recommended Articles


