


GBP/JPY Price Forecast: Six-month lows at the 209.20 area under pressure
- GBP/JPY extends its decline to session lows below 209.00, accumulating a 3.3% sell-off in the last four trading days.
- Hawkish comments by a Japanese official have provided a fresh boost to the Yen.
- The pair is testing the neckline of a large Head & Shoulders pattern, at the 209.20 area.
The British Pound (GBP) has resumed its bearish trend against a stronger Japanese Yen (JPY) on Monday, as comments from Japanese officials hinting at a steeper Bank of Japan (BoJ) monetary tightening cycle have provided a fresh boost to the Yen. The GBP/JPY pair shows a whopping 3.3% decline in the last four trading days and is testing key support above 209.00 at the time of writing.
Analysts at Danske Bank highlight a notable shift in domestic policy expectations, pointing out that in Japan, “Takuji Aida, economic adviser to PM Takaichi and seen as one of the most vocal opponents of BoJ rate hikes, now expects the Bank of Japan to raise rates at its 17-18 September meeting, followed by another hike by January next year.”
Danske adds that “at the same time, Aida warns that a faster tightening pace could weigh on the economy,” underscoring the delicate balance policymakers face as markets move to price a more hawkish BoJ path.
These remarks follow similar ones by BoJ committee member Hajime Takata last week and rather unambiguous pressures by US Treasury Secretary Scott Bessent to tighten monetary policy to support the Yen
Technical Analysis: Testing the neckline of a large H&S pattern
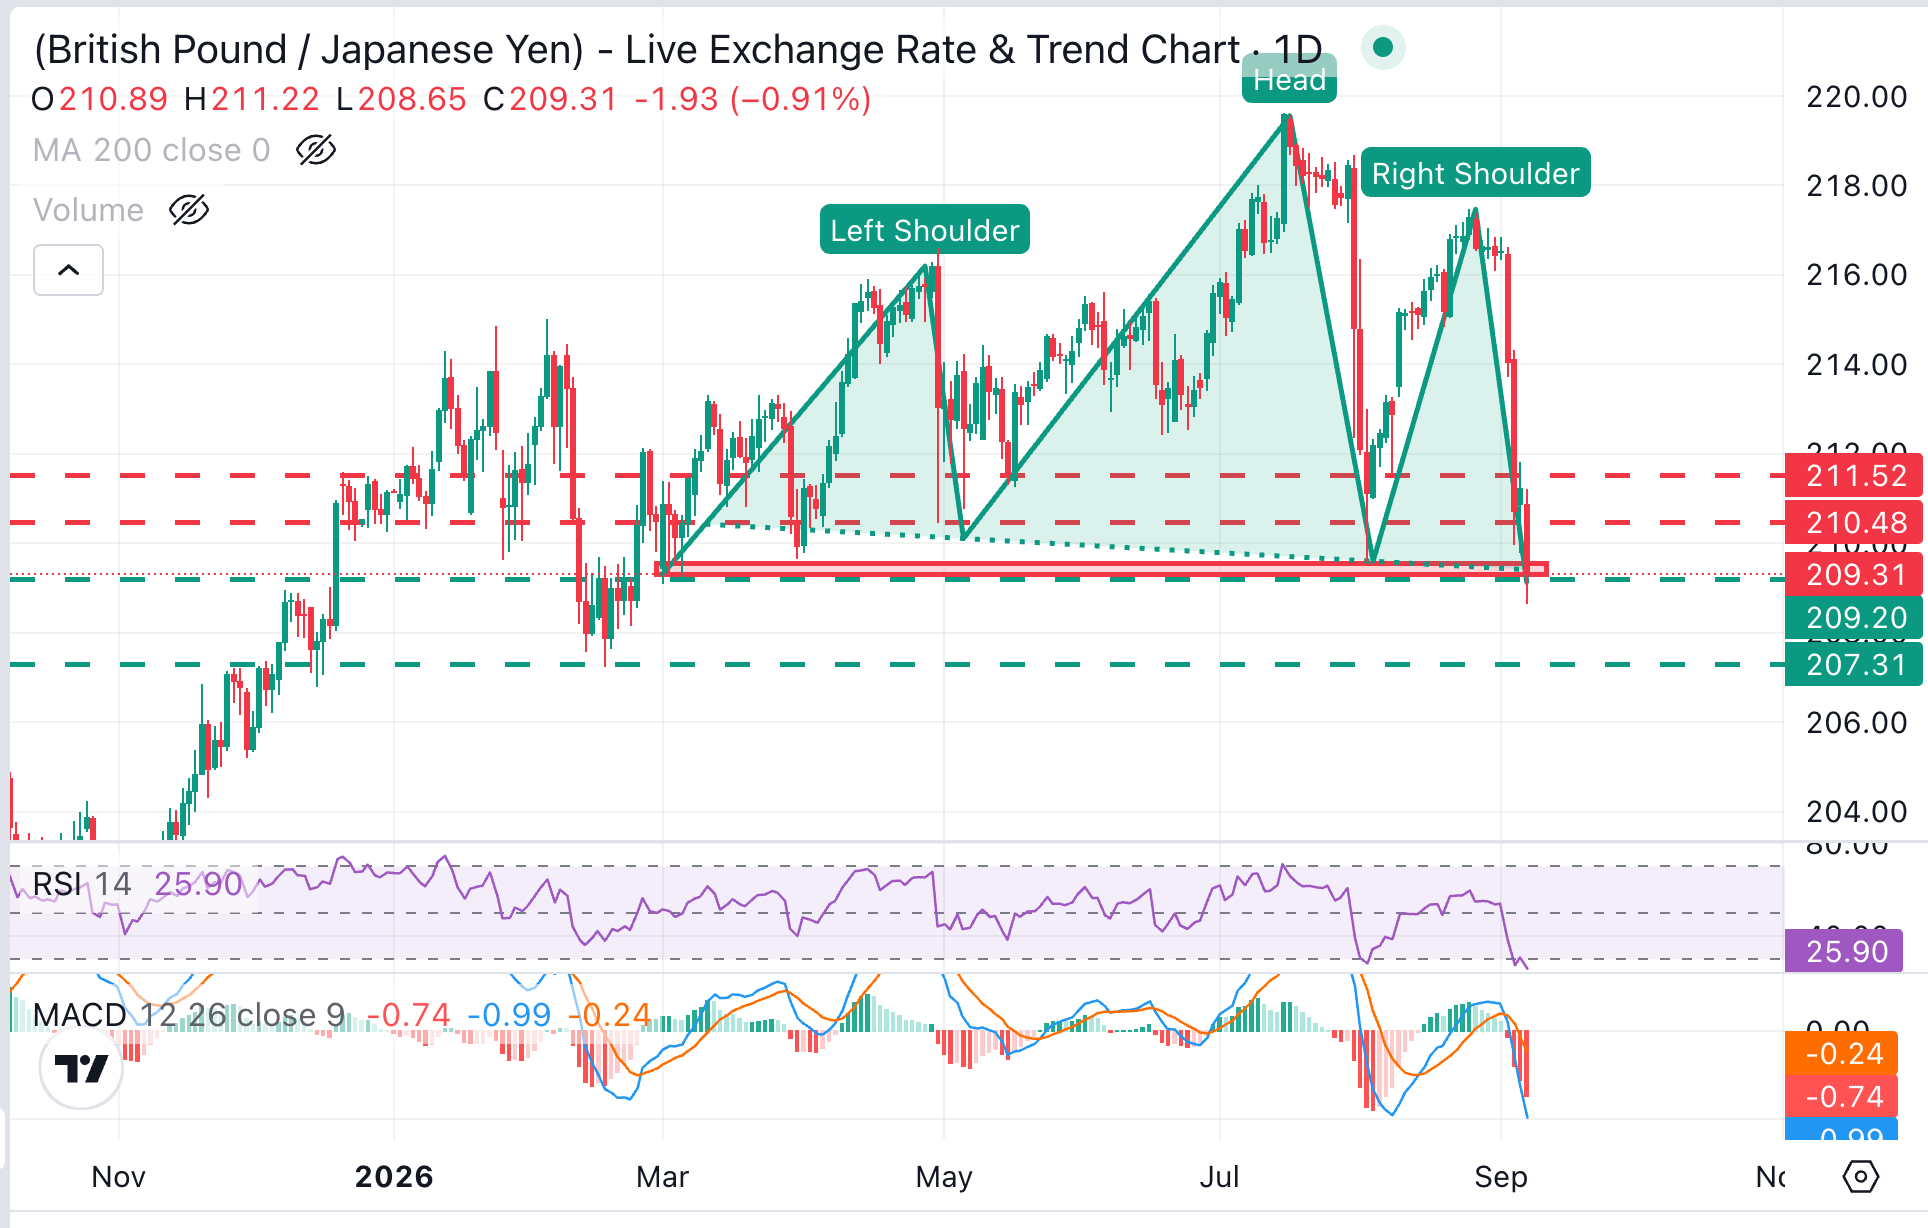
GBP/JPY trades at 209.38, maintaining a bearish near-term bias with price action holding just above the neckline of a Head & Shoulders (H&S) pattern, a common figure to spot trend shifts. Momentum indicators in the daily chart are deeply negative, with the Relative Strength Index (14) entering oversold territory near 26, with the Moving Average Convergence Divergence (MACD) well below zero, suggesting persistent downside pressure even as the pair risks short-lived corrective bounces.
A confirmation below the 209.20 level would expose the February 27 low at the 207.30 area. The downtrend, on the other hand, looks overextended, which might lead to some correction. In this case, previous support areas at 210.45 (April 30 low) and 211.50 (August 7 low) are likely to test bulls.
(The technical analysis of this story was written with the help of an AI tool. Know more.)
Japanese Yen Price Today
The table below shows the percentage change of Japanese Yen (JPY) against listed major currencies today. Japanese Yen was the strongest against the New Zealand Dollar.
| USD | EUR | GBP | JPY | CAD | AUD | NZD | CHF | |
|---|---|---|---|---|---|---|---|---|
| USD | -0.06% | -0.09% | -0.96% | -0.11% | -0.14% | 0.09% | -0.06% | |
| EUR | 0.06% | -0.03% | -0.90% | -0.08% | -0.08% | 0.14% | 0.00% | |
| GBP | 0.09% | 0.03% | -0.88% | -0.04% | -0.06% | 0.17% | 0.03% | |
| JPY | 0.96% | 0.90% | 0.88% | 0.87% | 0.84% | 1.09% | 0.95% | |
| CAD | 0.11% | 0.08% | 0.04% | -0.87% | -0.04% | 0.19% | 0.04% | |
| AUD | 0.14% | 0.08% | 0.06% | -0.84% | 0.04% | 0.24% | 0.07% | |
| NZD | -0.09% | -0.14% | -0.17% | -1.09% | -0.19% | -0.24% | -0.16% | |
| CHF | 0.06% | -0.01% | -0.03% | -0.95% | -0.04% | -0.07% | 0.16% |
The heat map shows percentage changes of major currencies against each other. The base currency is picked from the left column, while the quote currency is picked from the top row. For example, if you pick the Japanese Yen from the left column and move along the horizontal line to the US Dollar, the percentage change displayed in the box will represent JPY (base)/USD (quote).
Recommended Articles


