


USD/CHF Price Forecast: Pair extends recovery above key moving averages
- USD/CHF rises as hawkish Fed expectations and higher Treasury yields support the US Dollar.
- Subdued Swiss inflation reinforces expectations that the SNB will keep interest rates unchanged.
- Technically, USD/CHF holds above the 50-day SMA as bullish momentum rebuilds.
USD/CHF ticks higher on Tuesday as the US Dollar (USD) recoups most of the previous day’s losses. Hawkish Federal Reserve (Fed) expectations and rising US Treasury yields keep the Greenback underpinned near its recent highs. At the time of writing, the pair trades around 0.8103, up roughly 0.24% on the day.
Fed rate hike expectations have strengthened following Chair Kevin Warsh’s tough stance on inflation at the Jackson Hole Symposium. Warsh said the central bank would have more work to do if policymakers were not confident that inflation was returning to the 2% target. According to the CME FedWatch Tool, traders now see around a 65% probability of a rate hike at the September 15-16 meeting.
In contrast, subdued inflation in Switzerland, near the lower end of the Swiss National Bank’s (SNB) 0%-2% price-stability range, supports expectations that the central bank will keep its policy rate unchanged at 0% at its upcoming meetings. Switzerland’s August Consumer Price Index (CPI) data are due on Wednesday. Headline inflation is expected to be flat on a monthly basis after declining 0.1% in July, while the annual rate is forecast to rise to 0.5% from 0.4%.
Technical analysis
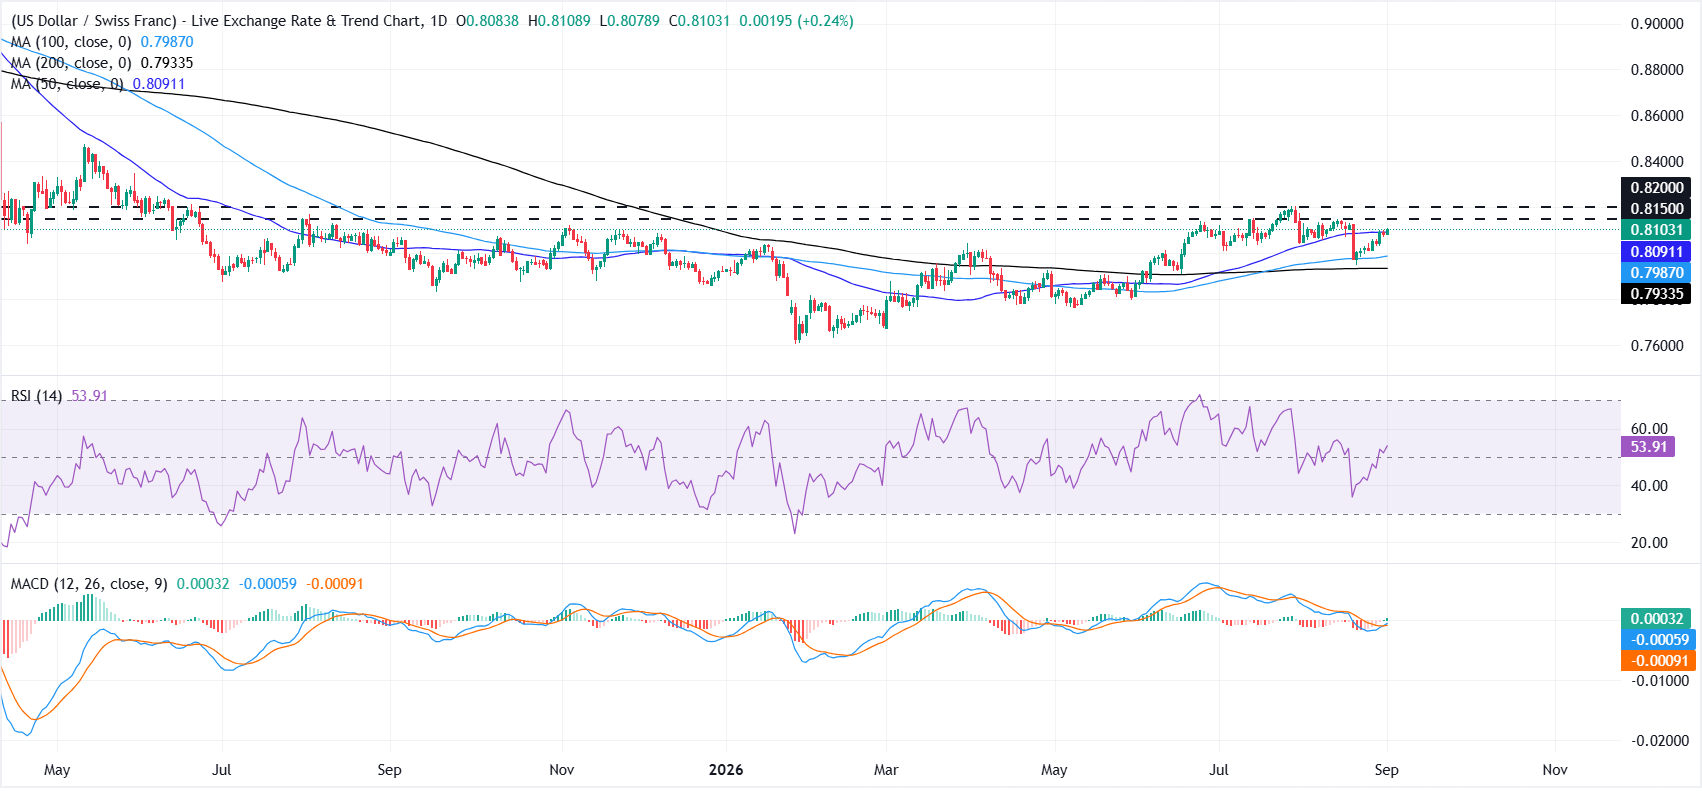
On the daily chart, USD/CHF holds above the key moving averages and retains a constructive bullish tone. The 50-day Simple Moving Average (SMA) at 0.8091 underpins the pair as immediate support, with the 100-day SMA at 0.7987 and the 200-day SMA at 0.7934 reinforcing a broader positive backdrop.
The Relative Strength Index (RSI) near 54 suggests moderate upside momentum, while the Moving Average Convergence Divergence (MACD) has turned slightly positive, hinting that buying pressure is gradually rebuilding after a recent pullback.
On the topside, initial resistance aligns with the horizontal barrier at 0.8150, ahead of a higher cap at 0.8200, where fresh offers could emerge. On the downside, a daily close below the 50-day SMA at 0.8091 would weaken the short-term bias and expose the next support layers at 0.7987 and 0.7934, where the longer-term SMAs are clustered and would be expected to attract dip-buying interest.
(The technical analysis of this story was written with the help of an AI tool. Know more.)
US Dollar Price Today
The table below shows the percentage change of US Dollar (USD) against listed major currencies today. US Dollar was the strongest against the New Zealand Dollar.
| USD | EUR | GBP | JPY | CAD | AUD | NZD | CHF | |
|---|---|---|---|---|---|---|---|---|
| USD | 0.22% | 0.13% | 0.22% | 0.22% | 0.25% | 0.25% | 0.24% | |
| EUR | -0.22% | -0.08% | 0.02% | -0.01% | 0.03% | 0.02% | 0.02% | |
| GBP | -0.13% | 0.08% | 0.09% | 0.09% | 0.11% | 0.11% | 0.10% | |
| JPY | -0.22% | -0.02% | -0.09% | -0.00% | 0.01% | 0.03% | -0.00% | |
| CAD | -0.22% | 0.00% | -0.09% | 0.00% | 0.02% | 0.00% | -0.01% | |
| AUD | -0.25% | -0.03% | -0.11% | -0.01% | -0.02% | 0.00% | -0.04% | |
| NZD | -0.25% | -0.02% | -0.11% | -0.03% | -0.01% | -0.00% | -0.01% | |
| CHF | -0.24% | -0.02% | -0.10% | 0.00% | 0.01% | 0.04% | 0.01% |
The heat map shows percentage changes of major currencies against each other. The base currency is picked from the left column, while the quote currency is picked from the top row. For example, if you pick the US Dollar from the left column and move along the horizontal line to the Japanese Yen, the percentage change displayed in the box will represent USD (base)/JPY (quote).
Recommended Articles


