


AUD/USD Price Forecast: Hot Australian CPI data boosts hawkish RBA bets
- The Australian Dollar strengthens after the release of the hotter-than-expected Australian CPI report for July.
- Hot Australian CPI data has prompted RBA interest rate hike expectations.
- The US PCE Inflation data for July is in focus.
The Australian Dollar (AUD) outperforms its major currency peers on Wednesday, trading 0.2% higher to near 0.7180 against the US Dollar (USD) during the early European trading session. The antipodean strengthens as hotter-than-projected Australian Consumer Price Index (CPI) data has prompted expectations of another interest rate hike by the Reserve Bank of Australia (RBA) this year.
Australian Dollar Price Today
The table below shows the percentage change of Australian Dollar (AUD) against listed major currencies today. Australian Dollar was the strongest against the New Zealand Dollar.
| USD | EUR | GBP | JPY | CAD | AUD | NZD | CHF | |
|---|---|---|---|---|---|---|---|---|
| USD | 0.08% | 0.11% | -0.13% | 0.16% | -0.23% | 0.35% | 0.23% | |
| EUR | -0.08% | 0.03% | -0.22% | 0.09% | -0.29% | 0.28% | 0.15% | |
| GBP | -0.11% | -0.03% | -0.24% | 0.06% | -0.32% | 0.26% | 0.12% | |
| JPY | 0.13% | 0.22% | 0.24% | 0.29% | -0.10% | 0.50% | 0.35% | |
| CAD | -0.16% | -0.09% | -0.06% | -0.29% | -0.39% | 0.22% | 0.06% | |
| AUD | 0.23% | 0.29% | 0.32% | 0.10% | 0.39% | 0.60% | 0.47% | |
| NZD | -0.35% | -0.28% | -0.26% | -0.50% | -0.22% | -0.60% | -0.15% | |
| CHF | -0.23% | -0.15% | -0.12% | -0.35% | -0.06% | -0.47% | 0.15% |
The heat map shows percentage changes of major currencies against each other. The base currency is picked from the left column, while the quote currency is picked from the top row. For example, if you pick the Australian Dollar from the left column and move along the horizontal line to the US Dollar, the percentage change displayed in the box will represent AUD (base)/USD (quote).
Earlier in the day, the Australian Bureau of Statistics reported that price pressures grew by 1% Month-on-Month (MoM) in July, faster than estimates of 0.8%. In June, the inflation data declined by 0.1%. On an annualized basis, the CPI growth was stronger at 3.5% from 3.2% estimates, but slower than the previous reading of 3.8%.
Market participants nudged up the chance of a fourth rate hike from the RBA in the September policy meeting to 36% from 17%, while a move by February next year is now priced at 94%.
The RBA minutes of the July policy meeting also showed on Tuesday that several board members see an interest rate hike “quite possible” if upside inflation risks start materializing.
On the US Dollar front, investors await the United States (US) Personal Consumption Expenditure Price Index (PCE) data for July, which will be published at 12:30 GMT. The US core PCE inflation, which is closely tracked by Federal Reserve (Fed) officials, is expected to have remained steady at 3.3% Year-on-Year (YoY), with monthly figures rising at a 0.2% pace, faster than the June reading of 0.1%.
AUD/USD Technical Analysis
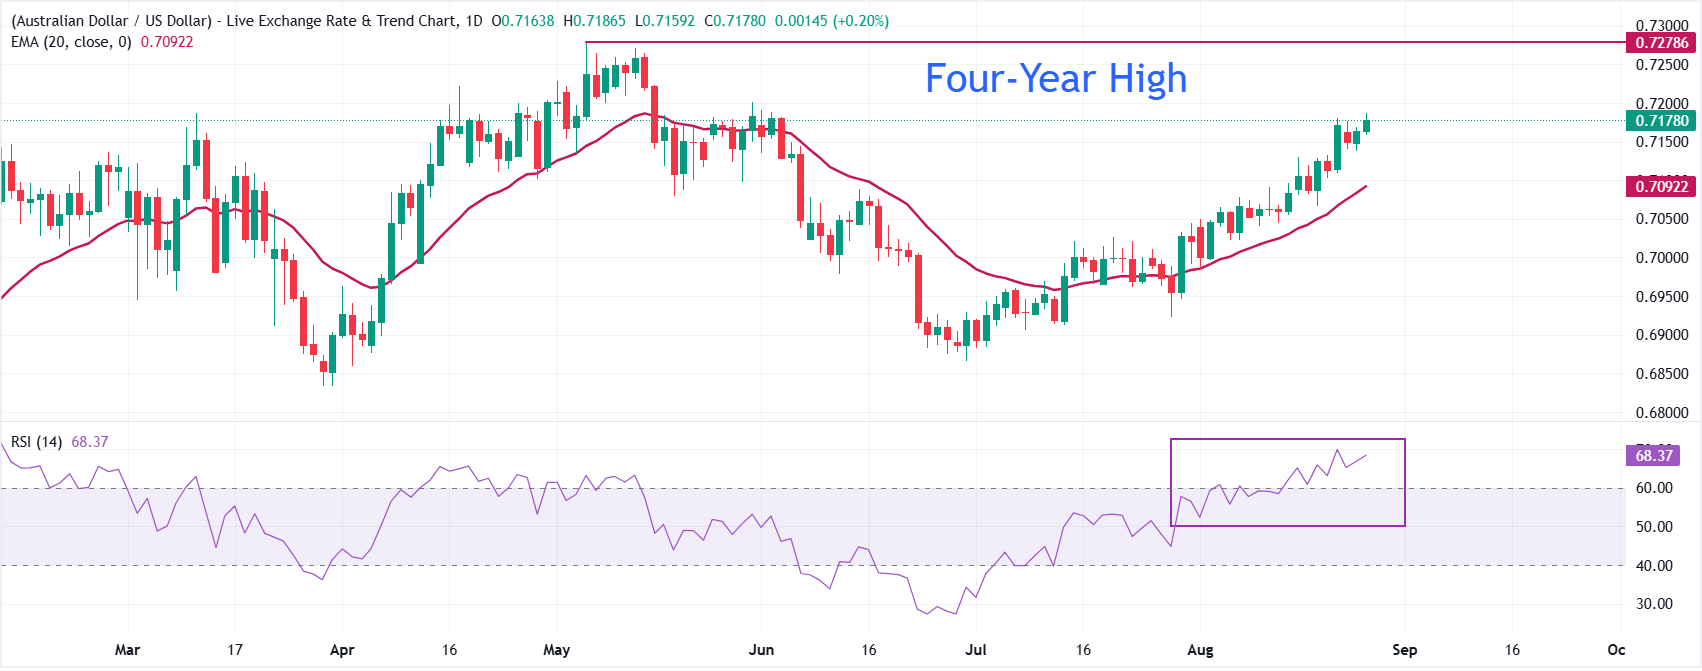
In the daily chart, AUD/USD trades at 0.7178. The pair holds above the 20-period exponential moving average (EMA) at 0.7092, keeping the near-term bias bullish. The Relative Strength Index (14) at 68.36 sits just shy of overbought territory, suggesting strong but increasingly stretched upside momentum as buyers stay in control.
On the downside, immediate support is seen at the day’s opening level around 0.7178, while the 20-period EMA at 0.7092 provides a deeper structural floor for any corrective pullback. Looking up, the pair needs to extend the advance decisively above the May 29 high at 0.7201 to revisit the four-year high at 0.7278.
(The technical analysis of this story was written with the help of an AI tool. Know more.)
Economic Indicator
Consumer Price Index (MoM)
The Monthly Consumer Price Index (CPI), released by theAustralian Bureau of Statistics on a monthly basis, measures the changes in the price of a comprehensive basket of goods and services acquired by household consumers. The MoM reading compares prices in the reference month to the previous one. A high reading is seen as bullish for the Australian Dollar (AUD), while a low reading is seen as bearish.
Read more.Last release: Wed Aug 26, 2026 01:30
Frequency: Monthly
Actual: 1%
Consensus: 0.8%
Previous: -0.1%
Source: Australian Bureau of Statistics
Recommended Articles


