


British Pound climbs as UK inflation keeps BoE hike bets alive
- GBP/USD advances as traders digest solid US jobless claims.
- Treasury buyback pressure fades as Dollar steadies near recent lows.
- UK Retail Sales and PMIs could steer BoE hike expectations.
The Pound Sterling advances on Thursday during the North American session, up 0.25% after US economic data revealed that the labour market remains solid, despite a weaker Nonfarm Payrolls in July. The GBP/USD trades at 1.3639 after reaching a daily low of 1.3594.
GBP/USD rises as UK inflation offsets solid US labor data
The Greenback has recovered some ground after posting losses, following the US Department of the Treasury's announcement of a bond buyback program. The Treasury’s goal is to provide liquidity for the long end of the curve, but markets interpreted the move as a form of Yield Curve Control (YCC).
The US Dollar Index (DXY), which measures the buck’s performance against a basket of six currencies, remains steady at 98.79, after refreshing two-and-a-half-month lows at 98.55, a level last seen in May 14.
Data-wise, the US Initial Jobless Claims for the week ending August 15, dipped from 212K down to 206K, below forecasts of 210K. At the same time, the 4-week average of jobless claims edged up from 199.75K to 204K, an increase of 5K.
Recently, Fed officials crossed the wires. St. Louis Fed Alberto Musalem said that strong growth and investment are influencing the bond market. He added that in July, he recommended raising rates, but for the September meeting, he remains open.
Earlier, San Francisco Fed Mary Daly said that a rise in long-term bond yields is a global issue, which reduces its usefulness as a signal for the Fed. She added that she doesn’t see Fed credibility as at risk and is making the case that the short end is reacting to the data.
In the UK, inflation hit a four-month high in July as confirmed by data released on Wednesday. Expectations that the Bank of England will raise rates in 2026 remain high, with traders expecting 25 basis points of tightening by the December meeting, as revealed by Prime Terminal.
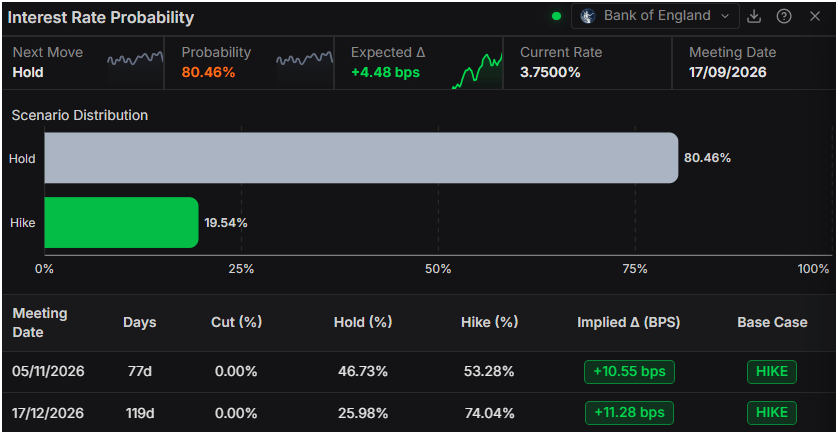
In the meantime, traders are eyeing the release of UK Retail Sales for July, which are expected to show that consumer spending decelerated. In addition, traders will eye S&P Global Flash PMIS. Across the pond, the US schedule will feature S&P Global Flash PMIs, amid a scarce week of data releases.
GBP/USD Price Forecast: Technical outlook
In the daily chart, GBP/USD trades at 1.3636, maintaining a bullish near-term bias as price holds above the cluster of former descending trend-line resistance now turned support around 1.3499–1.3409 and the 50/100/200-day simple moving average (SMA) group near 1.3390. The upward-sloping support lines, with break points at 1.3609 and 1.3366, reinforce the constructive structure, while the Relative Strength Index (14) at 70.49 edges into overbought territory, hinting that upside momentum is strong but vulnerable to consolidation.
On the downside, immediate support emerges at the recent highs around 1.3609, followed by the broken trend-line levels at 1.3499 and 1.3409, and then the dense SMA floor near 1.3390, with the lower rising trend-line break at 1.3366 acting as a deeper structural base. With no clear resistance levels defined above the market in the current dataset, the pair would likely need an overbought correction before bears can challenge this supportive zone, keeping the broader path of least resistance skewed to the upside while these levels hold.
(The technical analysis of this story was written with the help of an AI tool. Know more.)
Pound Sterling FAQs
The Pound Sterling (GBP) is the oldest currency in the world (886 AD) and the official currency of the United Kingdom. It is the fourth most traded unit for foreign exchange (FX) in the world, accounting for 12% of all transactions, averaging $630 billion a day, according to 2022 data. Its key trading pairs are GBP/USD, also known as ‘Cable’, which accounts for 11% of FX, GBP/JPY, or the ‘Dragon’ as it is known by traders (3%), and EUR/GBP (2%). The Pound Sterling is issued by the Bank of England (BoE).
The single most important factor influencing the value of the Pound Sterling is monetary policy decided by the Bank of England. The BoE bases its decisions on whether it has achieved its primary goal of “price stability” – a steady inflation rate of around 2%. Its primary tool for achieving this is the adjustment of interest rates. When inflation is too high, the BoE will try to rein it in by raising interest rates, making it more expensive for people and businesses to access credit. This is generally positive for GBP, as higher interest rates make the UK a more attractive place for global investors to park their money. When inflation falls too low it is a sign economic growth is slowing. In this scenario, the BoE will consider lowering interest rates to cheapen credit so businesses will borrow more to invest in growth-generating projects.
Data releases gauge the health of the economy and can impact the value of the Pound Sterling. Indicators such as GDP, Manufacturing and Services PMIs, and employment can all influence the direction of the GBP. A strong economy is good for Sterling. Not only does it attract more foreign investment but it may encourage the BoE to put up interest rates, which will directly strengthen GBP. Otherwise, if economic data is weak, the Pound Sterling is likely to fall.
Another significant data release for the Pound Sterling is the Trade Balance. This indicator measures the difference between what a country earns from its exports and what it spends on imports over a given period. If a country produces highly sought-after exports, its currency will benefit purely from the extra demand created from foreign buyers seeking to purchase these goods. Therefore, a positive net Trade Balance strengthens a currency and vice versa for a negative balance.
Recommended Articles


