


USD/CHF Price Forecast: Dollar, capped at 0.8100, hints at a potential “H&S” pattern
- USD/CHF stalls at 0.8100 amid hopes of a new round of peace talks in Iran.
- Investors remain wary of placing large US Dollar bets ahead of key US labour data releases.
- The technical picture shows a potential Head and Shoulders formation in progress.
The US Dollar (USD) shows marginal losses against the Swiss Franc (CHF) on Tuesday, as Dollar bulls struggle to find acceptance above 0.8100. Risk-appetite, amid hopes of peace talks between the US and Iran, and investors’ cautiousness ahead of key US macroeconomic releases due later this week are limiting US Dollar recovery attempts.
Market sentiment brightened moderately this week, as the US and Iran halted their hostilities to give a chance to the diplomatic way. News from the region, however remain contradictory. US President Donald Trump affirmed that this is the “last chance” for Iran to reach a good deal with the United States, but Tehran has denied any talks with the US.
Beyond that, the market awaits the release of a string of US employment releases this week, starting with the JOLTS Job Openings, due later on Tuesday and ending with Friday’s Nonfarm Payrolls report. These figures are expected to provide further insight into the US Federal Reserve’s (Fed) monetary policies and will, highly likely, set the US Dollar’s near-term direction.
Technical Analysis: US Dollar's rally is giving signs of exhaustion
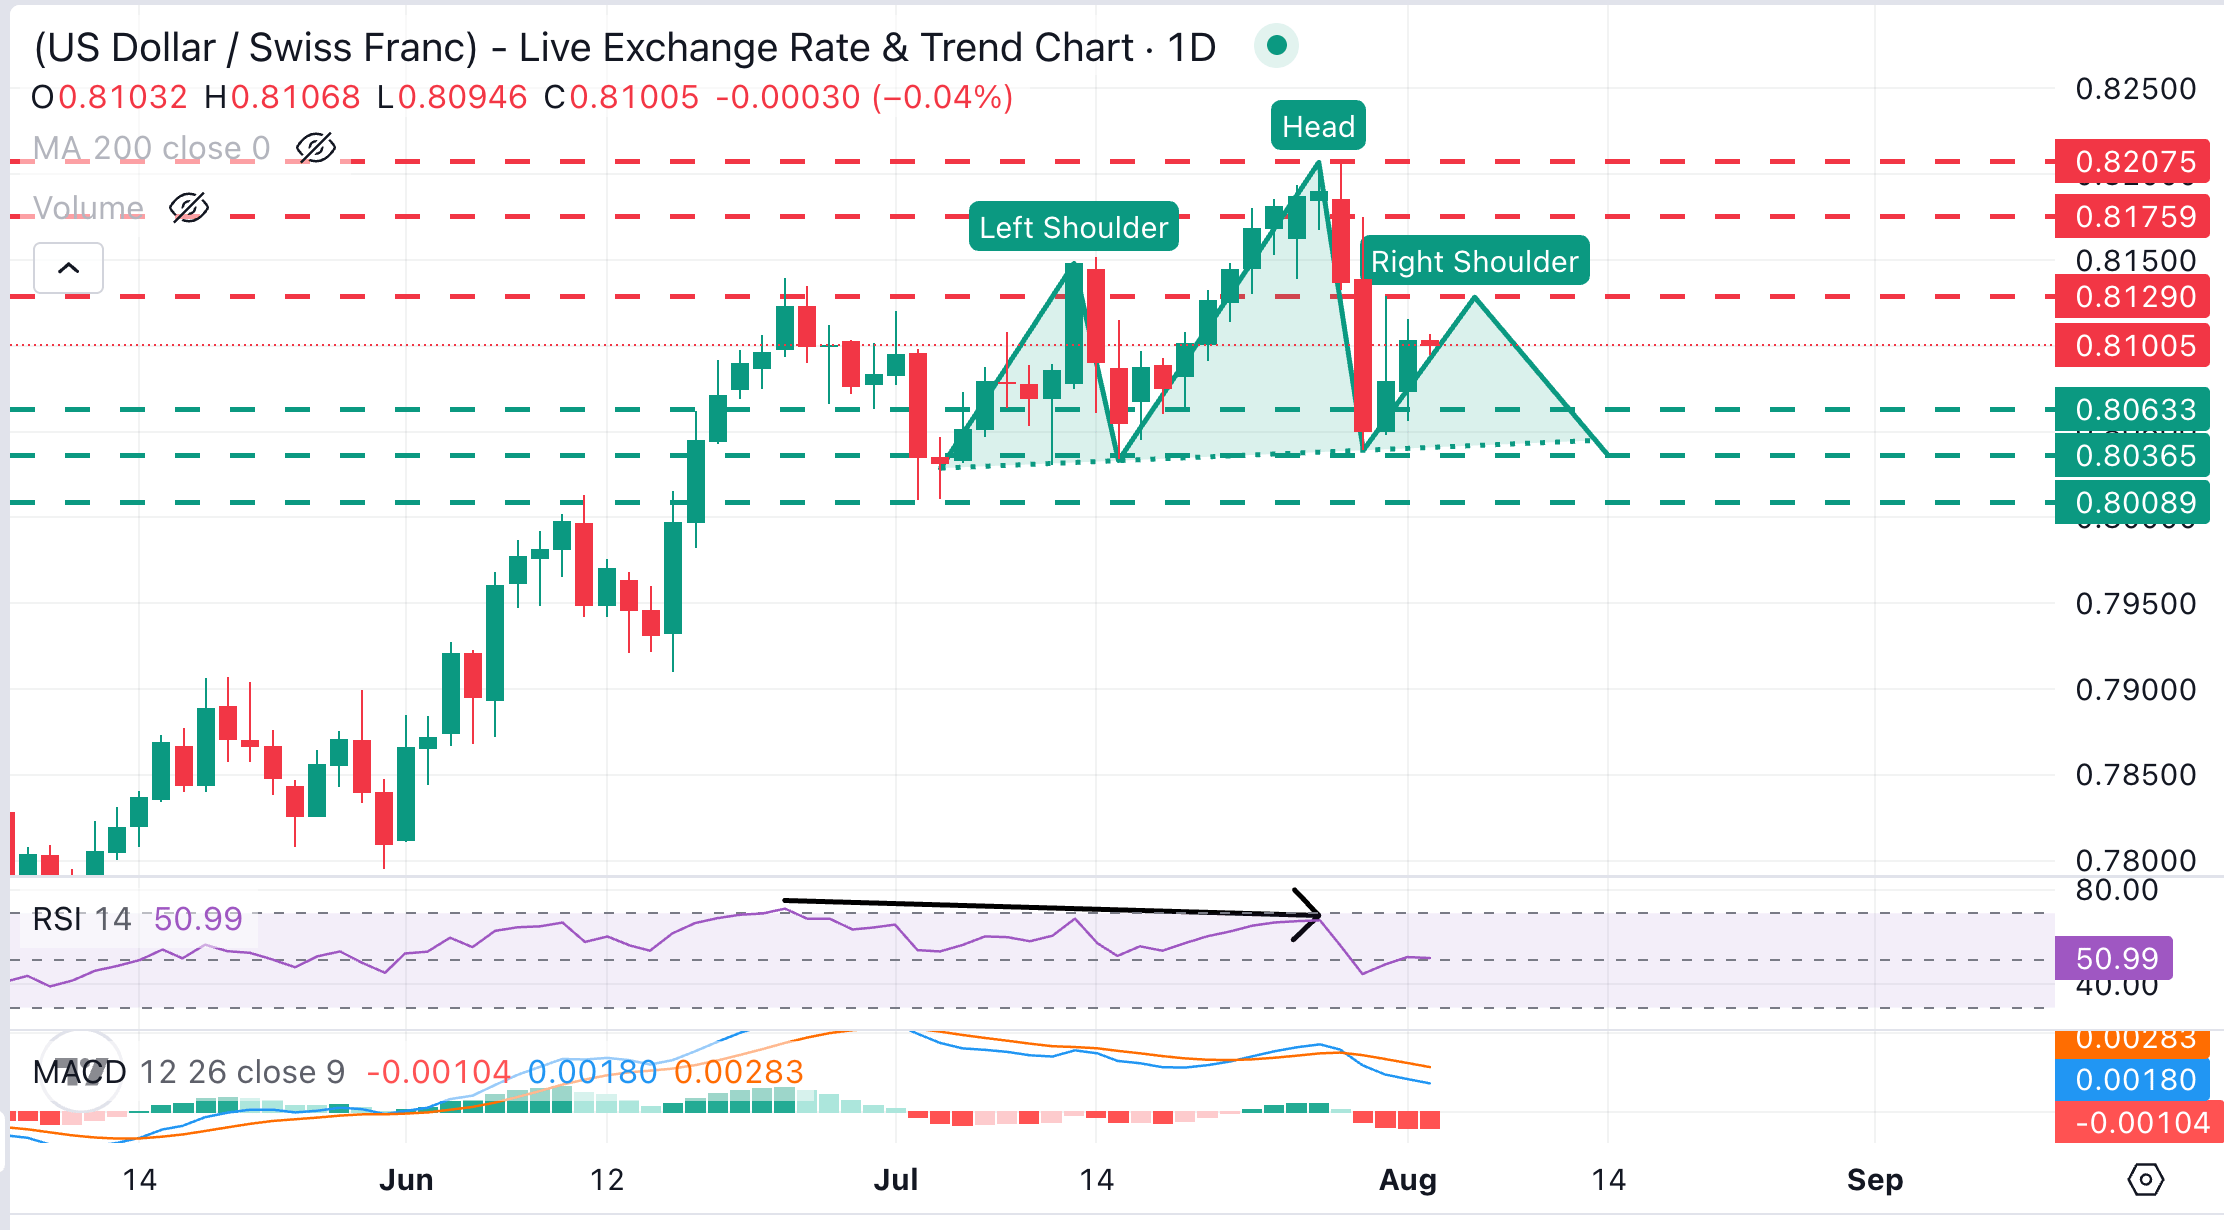
USD/CHF trades at 0.8101, consolidating gains after bouncing from lows around 0.8035. The sharp reversal from the 0.8200 highs seen last week, and bulls' challenges to extend gains beyond the 0.8100 area, however, are hinting at a potential Head & Shoulders (H&S) pattern, a common indicator of trend shifts.
The Relative Strength Index (14) in the daily chart has flattened around the 50 midline and is showing some bearish divergence, providing further hope for sellers. The Moving Average Convergence Divergence (MACD) indicator holds slightly below zero with flat lines, suggesting fading bullish pressure rather than an outright bearish break.
On the downside, the pair is likely to find support at Monday's low of 0.8056 ahead of the neckline of the H&S figure around last week's low, in the 0.8040 area. A deeper slide would expose the June 11 high, at 0.8113. On the topside, initial resistance appears at the July 31 high of 0.8128, ahead of the July 30 high of 0.8175. A break of last week's top around 0.8200 negates the bearish view.
(The technical analysis of this story was written with the help of an AI tool. Know more.)
US Dollar Price Today
The table below shows the percentage change of US Dollar (USD) against listed major currencies today. US Dollar was the strongest against the Japanese Yen.
| USD | EUR | GBP | JPY | CAD | AUD | NZD | CHF | |
|---|---|---|---|---|---|---|---|---|
| USD | -0.01% | -0.05% | 0.47% | -0.05% | -0.40% | -0.04% | -0.06% | |
| EUR | 0.00% | -0.06% | 0.51% | -0.05% | -0.38% | -0.05% | -0.04% | |
| GBP | 0.05% | 0.06% | 0.57% | 0.02% | -0.33% | 0.02% | 0.03% | |
| JPY | -0.47% | -0.51% | -0.57% | -0.55% | -0.88% | -0.56% | -0.43% | |
| CAD | 0.05% | 0.05% | -0.02% | 0.55% | -0.34% | -0.01% | 0.00% | |
| AUD | 0.40% | 0.38% | 0.33% | 0.88% | 0.34% | 0.35% | 0.33% | |
| NZD | 0.04% | 0.05% | -0.02% | 0.56% | 0.00% | -0.35% | 0.02% | |
| CHF | 0.06% | 0.04% | -0.03% | 0.43% | -0.01% | -0.33% | -0.02% |
The heat map shows percentage changes of major currencies against each other. The base currency is picked from the left column, while the quote currency is picked from the top row. For example, if you pick the US Dollar from the left column and move along the horizontal line to the Japanese Yen, the percentage change displayed in the box will represent USD (base)/JPY (quote).
Recommended Articles


