


Tesla Inc Stock (TSLA) Moved Up by 3.53% on Oct 19: A Full Analysis
Tesla Inc (TSLA) moved up by 3.53%. The Automobiles & Auto Parts sector is up by 1.55%. The company outperformed the industry. Top 3 stocks by turnover in the sector: Tesla Inc (TSLA) up 3.51%; General Motors Co (GM) down 1.05%; Cummins Inc (CMI) down 1.06%.
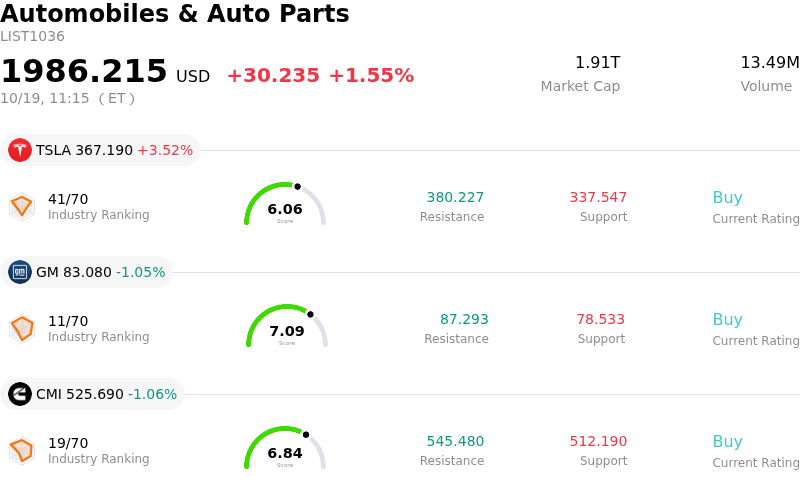
What is driving Tesla Inc (TSLA)’s stock price up today?
Tesla shares experienced strong buying pressure and heightened intraday volatility as investors positioned themselves ahead of the company's third-quarter earnings report. Market participants are balancing near-term margin concerns against strong top-line operational indicators, anchored by third-quarter vehicle delivery numbers that surpassed consensus expectations and confirmed major global delivery milestones. The solid delivery data has reaffirmed robust underlying demand, helping absorb broader market uncertainty and providing upward momentum for the equity.
Investor sentiment was further bolstered by the release of Tesla's definitive proxy statement filing, which highlighted governance adjustments and deepened strategic alignment across Elon Musk's broader technology ecosystem. Market speculation surrounding potential cross-platform synergies, technology sharing, and long-term consolidation across artificial intelligence and autonomous hardware provided a powerful catalyst. This strategic alignment has energized both retail and institutional buyers looking for multi-year growth drivers beyond standard automotive manufacturing.
In addition to corporate disclosures, sentiment was driven by publicity surrounding high-profile technology developments, including the redesigned Roadster prototype featuring advanced aerospace thruster integration, alongside ongoing progress in autonomous Cybercab field testing and Optimus robotics production planning. Although Wall Street analysts remain attentive to upcoming margin disclosures, operational cash flows, and leadership shifts within the energy business, expanding energy storage deployments and long-term tech initiatives drove strong capital inflows during the session.
Technical Analysis of Tesla Inc (TSLA)
Technically, Tesla Inc (TSLA) shows a MACD (12,26,9) value of -3.689, indicating a neutral signal. The RSI at 50.108 suggests neutral condition and the Williams %R at 50.187 suggests neutral condition. Please monitor closely.
Media Coverage of Tesla Inc (TSLA)
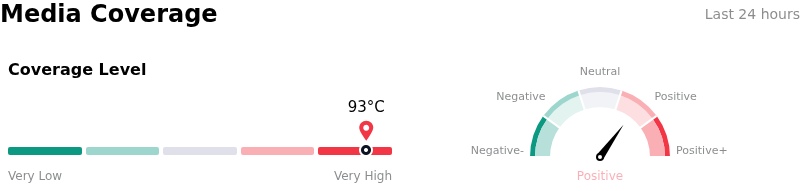
In terms of media coverage, Tesla Inc (TSLA) shows a coverage score of 93, indicating a very high level of media attention. The overall market sentiment index is currently in bullish zone.
Fundamental Analysis of Tesla Inc (TSLA)
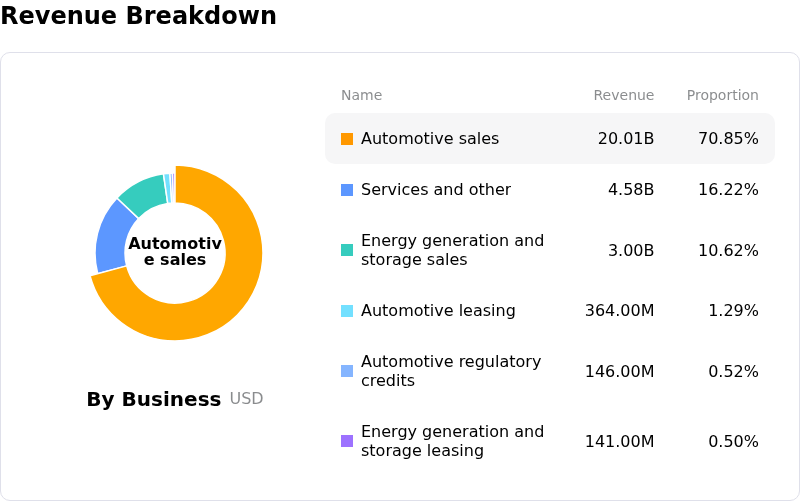
Tesla Inc (TSLA) is in the Automobiles & Auto Parts industry. Its latest annual revenue is $94.83B, ranking 6 in the industry. The net profit is $3.79B, ranking 2 in the industry. Company Profile
Over the past month, multiple analysts have rated the company as Buy, with an average price target of $383.18, a high of $550.00, and a low of $24.86.
More details about Tesla Inc (TSLA)
Company Specific Risks:
- Margin Compression and Cash Flow Erosion: Recent financial performance highlights operating margins shrinking to 1.4% as operating expenses jumped 47% and capital expenditures surged past $25 billion, turning free cash flow negative and escalating downside sensitivity ahead of the upcoming Q3 financial results.
- Ongoing Full Self-Driving Litigation Exposure: Although a federal appeals court overturned a broad class-action status, the underlying false advertising lawsuit remains active on its merits, preserving long-term liability and regulatory risks surrounding marketing claims for vehicle autonomous hardware.
- Governance and Executive Compensation Scrutiny: Recent proxy statement disclosures outlining accelerated compensation provisions for CEO Elon Musk during prospective corporate actions involving SpaceX have refocused institutional analyst concerns on board oversight and potential conflicts of interest.
- Valuation Multiples Vulnerable to Growth Execution: Trading at a trailing price-to-earnings ratio exceeding 330x, the stock faces extreme intraday volatility if subscription revenue from Full Self-Driving and Robotaxi expansion fails to justify heavy upfront artificial intelligence investments.
Recommended Articles


