


SanDisk Corporation Stock (SNDK) Moved Up by 6.56% on Oct 19: What Investors Need To Know
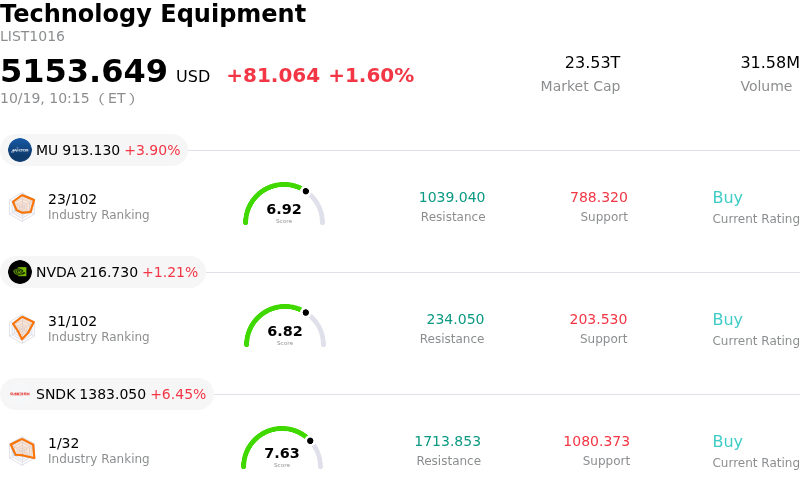
SanDisk Corporation (SNDK) moved up by 6.56%. The Technology Equipment sector is up by 1.60%. The company outperformed the industry. Top 3 stocks by turnover in the sector: Micron Technology Inc (MU) up 3.97%; NVIDIA Corp (NVDA) up 1.24%; SanDisk Corporation (SNDK) up 6.43%.
What is driving SanDisk Corporation (SNDK)’s stock price up today?
The upward momentum in SanDisk shares reflects a broad technical and fundamental rebound across the memory semiconductor sector following an aggressive short-term pullback. Market sentiment quickly stabilized as institutional investors stepped back in to buy the dip, dismissing recent market anxieties surrounding global memory supply growth as overdone. The broader technology tape provided strong tailwinds, with memory and hardware providers rallying in tandem as capital flows returned to core artificial intelligence infrastructure plays.
SanDisk's medium-term growth profile remains firmly tied to the explosive buildout of AI data centers, which require vast quantities of high-performance NAND flash storage and enterprise solid-state drives. Advanced product architectures, such as high-density BiCS8 storage technology, continue to secure strong demand from hyperscale cloud operators seeking higher rack efficiency and reduced power consumption. This structural demand is reinforced by substantial long-term customer supply agreements and multi-billion-dollar share buyback programs, providing clear earnings visibility and operational downside protection.
Tactical positioning ahead of the company's upcoming fiscal first-quarter earnings report has further amplified buying pressure. Wall Street analyst consensus remains overwhelmingly positive, citing deep valuation compression relative to medium-term earnings capacity. As macro anxiety eases and focus shifts back to robust enterprise data storage fundamentals, investor appetite has turned decisively optimistic, driving notable intraday strength.
Technical Analysis of SanDisk Corporation (SNDK)
Technically, SanDisk Corporation (SNDK) shows a MACD (12,26,9) value of -89.162, indicating a sell signal. The RSI at 36.543 suggests neutral condition and the Williams %R at 81.027 suggests oversold condition. Please monitor closely.
Media Coverage of SanDisk Corporation (SNDK)
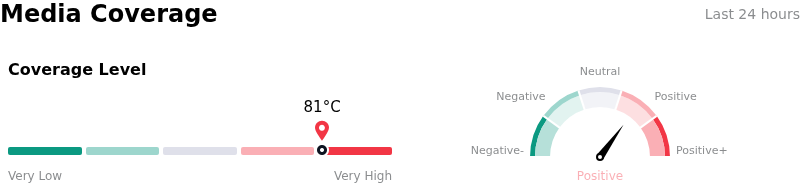
In terms of media coverage, SanDisk Corporation (SNDK) shows a coverage score of 81, indicating a very high level of media attention. The overall market sentiment index is currently in bullish zone.
Fundamental Analysis of SanDisk Corporation (SNDK)
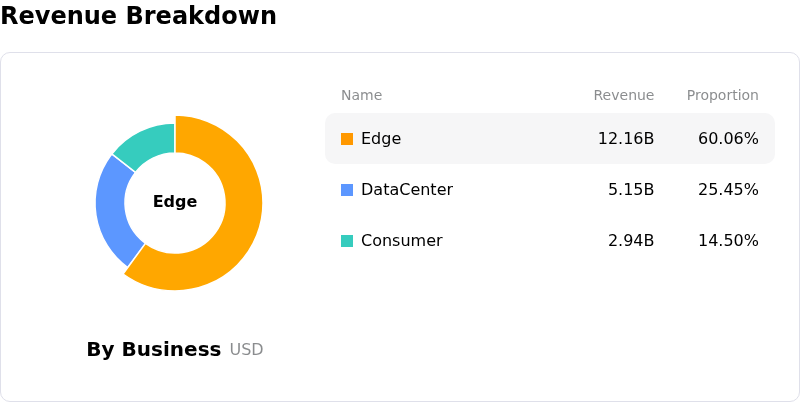
SanDisk Corporation (SNDK) is in the Technology Equipment industry. Its latest annual revenue is $20.25B, ranking 8 in the industry. The net profit is $11.43B, ranking 2 in the industry. Company Profile
Over the past month, multiple analysts have rated the company as Buy, with an average price target of $2133.62, a high of $3000.00, and a low of $1020.00.
More details about SanDisk Corporation (SNDK)
Company Specific Risks:
- Spillover Contagion from Chinese Memory Breakthroughs: The stock experienced an 18% pullback following news that Chinese manufacturer ChangXin Memory Technologies is advancing high-density server memory, stoking broad market fears of Chinese overcapacity and pricing erosion across the memory storage sector.
- Uncertainty Surrounding Peak NAND Margin Sustainability: Institutional reports highlight growing concerns that Sandisk's elevated 84.6% gross margins and pricing power reflect peak-cycle conditions, leaving profitability vulnerable to severe compression as supply and demand normalize.
- AI Data Center Financing and Capital Expenditure Headwinds: Broader volatility in technology and AI stocks, driven by macroeconomic rate concerns and financing questions within Neocloud providers, poses immediate downside risk to enterprise SSD storage growth.
- Extreme Beta Volatility and Downside Momentum: Carrying a high beta coefficient of 3.60, the stock has suffered a drawdown of over 26% from its 52-week peak of $2,354.39, driving heightened intraday volatility and liquidation risk ahead of its October 29 quarterly earnings report.
Recommended Articles


