


Loonie gives back part of its rally on soft Canadian inflation
- USD/CAD bounces off its lowest since September 23 as Canadian inflation misses.
- Core inflation eases to 2.2%, and gasoline is up 27.8% from a year earlier.
- Canadian retail sales are due Friday, the last release before the BoC meets.
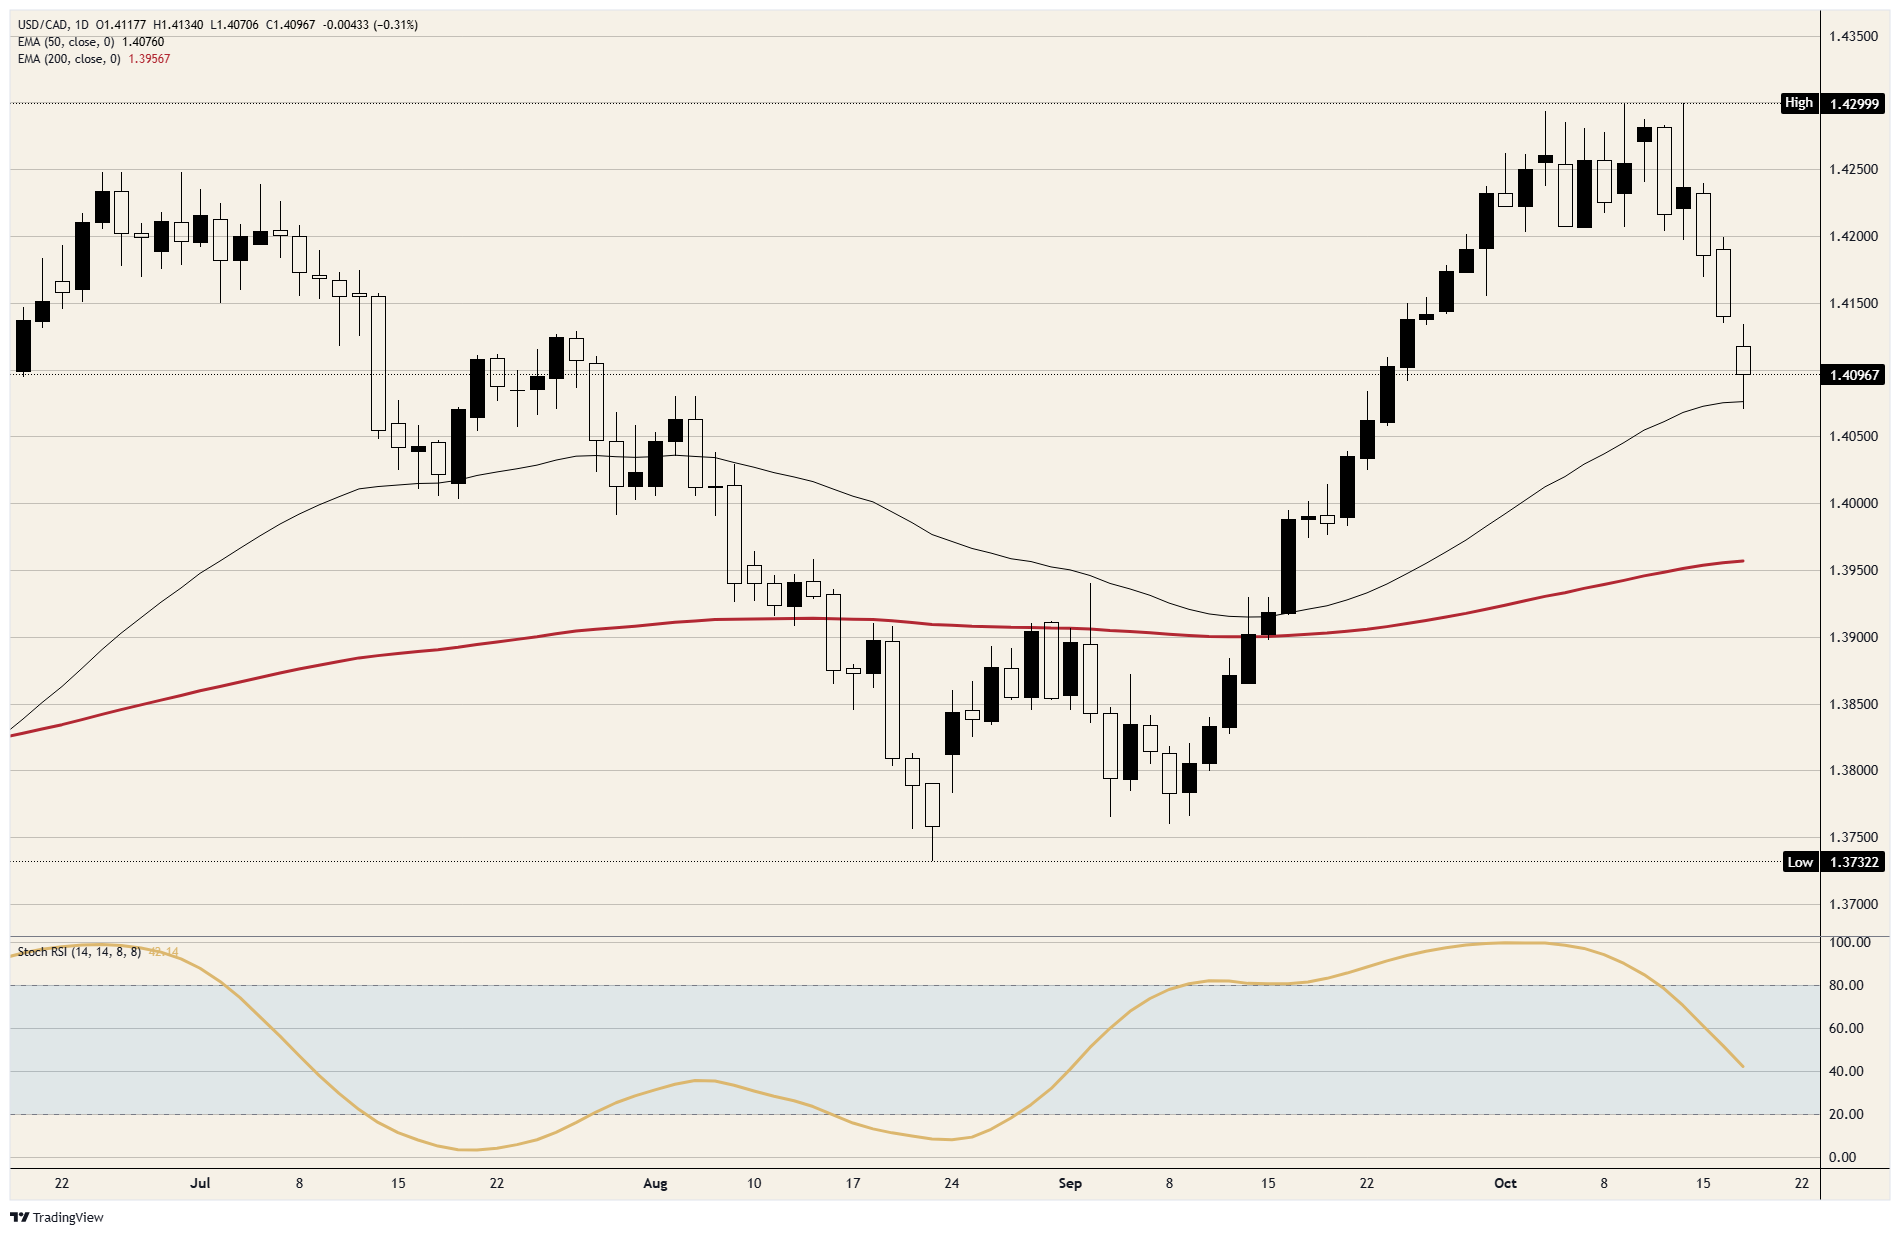
Canadian inflation came in under forecast, and USD/CAD rose off its lowest level since September 23 on the release, though it's still on track for a third straight loss. The low just above 1.4050 came in the bars before the numbers, and the price went back above 1.4100 in the release bar. It has slipped back under 1.4100 since, with Friday's last trade just under 1.4150.
Headline inflation rose to 3.1% in September against a 3.2% forecast, with gasoline up 27.8% from a year earlier. The Bank of Canada (BoC) core measure eased to 2.2% from 2.4%, and core prices were flat on the month. Analysts read the flat core month as a reason to keep the BoC's 2.25%, unchanged all year, below the Fed's 3.75%-4.00% on October 28.
BoC surveys published after the release showed consumers' five-year inflation expectations up to 3.91% from 3.39%, and firms' expectations climbed after Canada-US trade talks failed. Scotiabank and Bank of Montreal then both called for a quarter-point hike on October 28, which would cut the gap to the Fed by the same amount. The BoC published two business surveys on the same day, and sentiment rose in the one taken mostly before the talks collapsed.
On the calendar
Canada's August retail sales are due at 12:30 GMT on Friday, forecast up 1.3% after a 0.7% fall, with sales excluding autos forecast up 1% after the same fall. It's the last Canadian release before the BoC's October 28 decision.
Fed officials are in their quiet period before the October 27-28 meeting, where futures put a hike near 15% and one by December near 89%. US weekly jobless claims are due at 12:30 GMT on Thursday, forecast at 200K after 199K. The S&P Global flash Purchasing Managers Index (PMI) surveys follow at 13:45 GMT on Friday, with services forecast at 57.9 after 58.8.
On the charts
USD/CAD went just under its 50-day Exponential Moving Average (EMA) at the session low, its first trade below the average since mid-September. The slide from the two highs near 1.4300 on October 9 and October 14 has given back about two-fifths of the climb from the September 8 low near 1.3750.
USD/CAD daily chart
Canadian Dollar FAQs
The key factors driving the Canadian Dollar (CAD) are the level of interest rates set by the Bank of Canada (BoC), the price of Oil, Canada’s largest export, the health of its economy, inflation and the Trade Balance, which is the difference between the value of Canada’s exports versus its imports. Other factors include market sentiment – whether investors are taking on more risky assets (risk-on) or seeking safe-havens (risk-off) – with risk-on being CAD-positive. As its largest trading partner, the health of the US economy is also a key factor influencing the Canadian Dollar.
The Bank of Canada (BoC) has a significant influence on the Canadian Dollar by setting the level of interest rates that banks can lend to one another. This influences the level of interest rates for everyone. The main goal of the BoC is to maintain inflation at 1-3% by adjusting interest rates up or down. Relatively higher interest rates tend to be positive for the CAD. The Bank of Canada can also use quantitative easing and tightening to influence credit conditions, with the former CAD-negative and the latter CAD-positive.
The price of Oil is a key factor impacting the value of the Canadian Dollar. Petroleum is Canada’s biggest export, so Oil price tends to have an immediate impact on the CAD value. Generally, if Oil price rises CAD also goes up, as aggregate demand for the currency increases. The opposite is the case if the price of Oil falls. Higher Oil prices also tend to result in a greater likelihood of a positive Trade Balance, which is also supportive of the CAD.
While inflation had always traditionally been thought of as a negative factor for a currency since it lowers the value of money, the opposite has actually been the case in modern times with the relaxation of cross-border capital controls. Higher inflation tends to lead central banks to put up interest rates which attracts more capital inflows from global investors seeking a lucrative place to keep their money. This increases demand for the local currency, which in Canada’s case is the Canadian Dollar.
Macroeconomic data releases gauge the health of the economy and can have an impact on the Canadian Dollar. Indicators such as GDP, Manufacturing and Services PMIs, employment, and consumer sentiment surveys can all influence the direction of the CAD. A strong economy is good for the Canadian Dollar. Not only does it attract more foreign investment but it may encourage the Bank of Canada to put up interest rates, leading to a stronger currency. If economic data is weak, however, the CAD is likely to fall.
Recommended Articles


