


Hewlett Packard Enterprise Co Stock (HPE) Moved Down by 5.00% on Oct 12: Key Drivers Unveiled
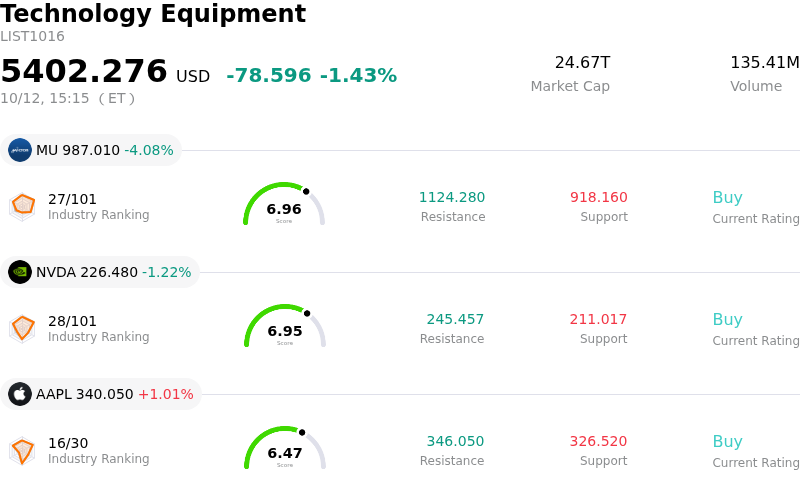
Hewlett Packard Enterprise Co (HPE) moved down by 5.00%. The Technology Equipment sector is down by 1.43%. The company underperformed the industry. Top 3 stocks by turnover in the sector: Micron Technology Inc (MU) down 4.08%; NVIDIA Corp (NVDA) down 1.22%; Apple Inc (AAPL) up 1.01%.
What is driving Hewlett Packard Enterprise Co (HPE)’s stock price down today?
The pullback in Hewlett Packard Enterprise shares reflects broad-based profit-taking following an extended, multi-week rally. The company’s equity had recently reached fresh multi-month highs, fueled by strong enthusiasm surrounding artificial intelligence infrastructure orders, server growth, and raised long-term outlooks for its high-margin networking segment. With key momentum metrics stretching into overbought territory and forward valuation multiples expanding well above historical historical baselines, market participants utilized the recent broader tech consolidation as an opportunity to lock in capital gains.
Short-term market sentiment was further dampened by recent regulatory disclosures of insider share sales, including transactions by executive leadership under automated trading plans. While insider dispositions under pre-arranged plans are routine operational steps, concentrated selling near record valuation peaks can trigger cautious repositioning across institutional portfolios. Furthermore, while HPE continues to build a massive order backlog across its enterprise compute and networking platforms, investors remain vigilant regarding potential hardware supply constraints and the precise timing of revenue recognition across multi-quarter deployment cycles.
Despite the intraday selloff, HPE’s core strategic thesis remains underpinned by durable enterprise demand for AI-optimized server architectures and hybrid cloud management. Enhanced collaboration with major chip suppliers and expanding adoption of integrated hardware-software offerings keep long-term growth fundamentals intact. The current price weakness highlights a natural consolidation period to absorb rapid past gains rather than a fundamental break in long-term AI infrastructure momentum.
Technical Analysis of Hewlett Packard Enterprise Co (HPE)
Technically, Hewlett Packard Enterprise Co (HPE) shows a MACD (12,26,9) value of 1.032, indicating a buy signal. The RSI at 61.803 suggests neutral condition and the Williams %R at 29.439 suggests buy condition. Please monitor closely.
Media Coverage of Hewlett Packard Enterprise Co (HPE)
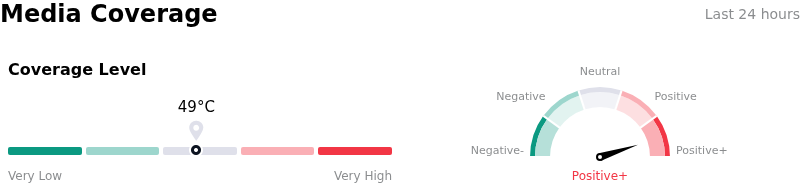
In terms of media coverage, Hewlett Packard Enterprise Co (HPE) shows a coverage score of 49, indicating a moderate level of media attention. The overall market sentiment index is currently in extremely bullish zone.
Fundamental Analysis of Hewlett Packard Enterprise Co (HPE)
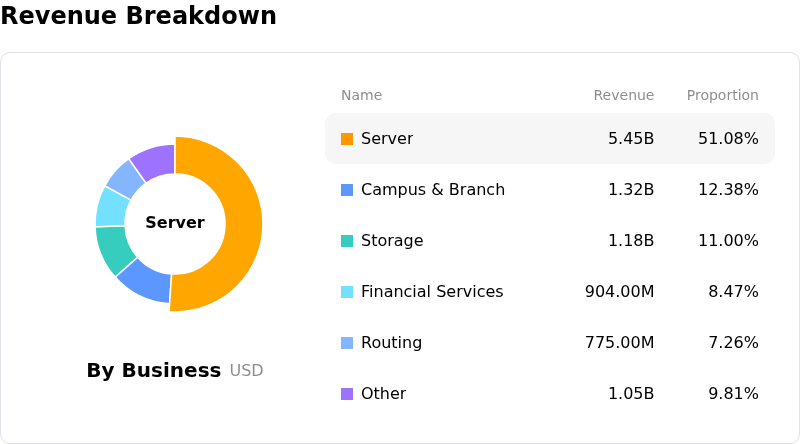
Hewlett Packard Enterprise Co (HPE) is in the Technology Equipment industry. Its latest annual revenue is $34.30B, ranking 7 in the industry. The net profit is $-59.00M, ranking 38 in the industry. Company Profile
Over the past month, multiple analysts have rated the company as Buy, with an average price target of $71.89, a high of $92.00, and a low of $52.59.
More details about Hewlett Packard Enterprise Co (HPE)
Company Specific Risks:
- AI Systems Margin Dilution: Increased revenue mix toward artificial intelligence infrastructure systems poses gross margin compression risks, as AI servers yield significantly lower profit margins than HPE's traditional enterprise networking products.
- Stretched Valuation and Analyst Downgrades: Wall Street downgrades to In-Line highlight a balanced risk-reward profile following a steep price run-up, while overbought technical indicators and steepened put-call options skew reflect heightened downside volatility and institutional profit-taking.
- Component Supply Bottlenecks: Persistent supply chain constraints in networking hardware and server components risk delaying order fulfillment, threatening the conversion of HPE's backlog into free cash flow during the ongoing integration of Juniper Networks.
- Heavy Insider Selling Activity: Recent SEC filings reveal over $10 million in insider stock sales over the past quarter with zero open-market purchases, raising governance concerns regarding executive confidence at current valuation levels.
Recommended Articles


