


T-Mobile US Inc Stock (TMUS) Moved Up by 3.08% on Oct 12: Key Drivers Unveiled
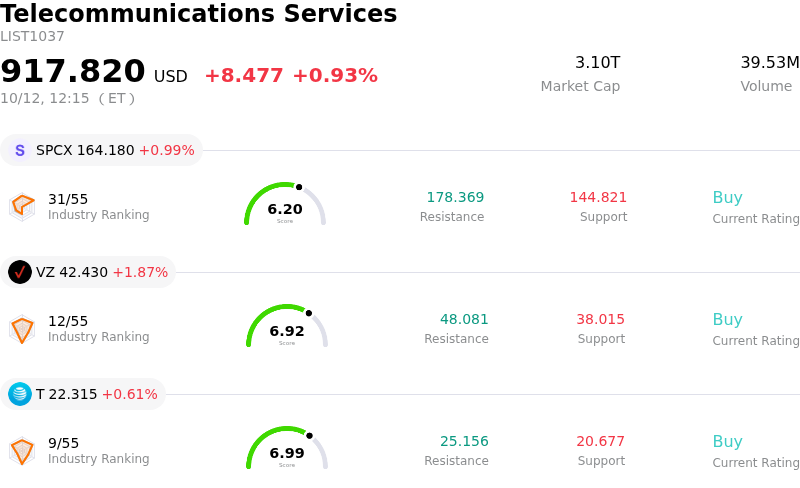
T-Mobile US Inc (TMUS) moved up by 3.08%. The Telecommunications Services sector is up by 0.93%. The company outperformed the industry. Top 3 stocks by turnover in the sector: SpaceX (SPCX) up 0.99%; Verizon Communications Inc (VZ) up 1.87%; AT&T Inc (T) up 0.61%.
What is driving T-Mobile US Inc (TMUS)’s stock price up today?
T-Mobile US experienced a strong upward move accompanied by notable intraday volatility, recovering a portion of the steep losses incurred during the prior trading session. The rebound was largely propelled by positive sell-side analyst action and institutional bargain hunting, as market participants reassessed the immediate threat posed by emerging direct-to-device and terrestrial spectrum deals.
A primary catalyst for today's price gain was an upgrade by Raymond James, which raised its rating on T-Mobile from Market Perform to Outperform with a target price of 170 dollars. Wall Street analysts pushed back against the extreme market selloff sparked by SpaceX's agreement to acquire nationwide 800 MHz spectrum from Grain Management, labeling competitive fears as overblown. Research notes underscored that deploying a viable nationwide ground-based wireless network requires years of heavy capital expenditure and complex infrastructure development. In addition, T-Mobile retains a dominant spectrum advantage with approximately 400 MHz, compared to the far smaller holdings accumulated by satellite operators, keeping its core 5G network positioning intact.
Beyond analyst upgrades, valuation metrics and upcoming operational catalysts played a central role in driving buying activity. Following the sharp retreat, institutional investors stepped in to capitalize on T-Mobile's attractive free cash flow profile and expanded yield metrics. With third-quarter earnings scheduled for release in late October, expectations remain focused on strong service revenue momentum and operational efficiency. The combination of oversold technical conditions, favorable Wall Street commentary, and resilient fundamental cash flow generation provided solid support for the stock's recovery.
Technical Analysis of T-Mobile US Inc (TMUS)
Technically, T-Mobile US Inc (TMUS) shows a MACD (12,26,9) value of -1.495, indicating a sell signal. The RSI at 35.409 suggests neutral condition and the Williams %R at 77.824 suggests sell condition. Please monitor closely.
Media Coverage of T-Mobile US Inc (TMUS)
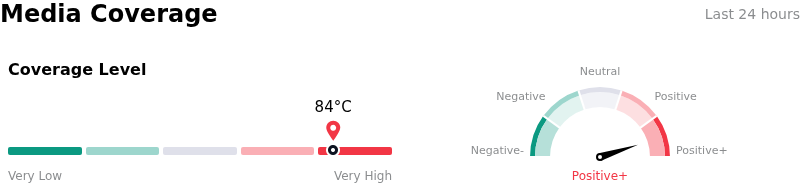
In terms of media coverage, T-Mobile US Inc (TMUS) shows a coverage score of 84, indicating a very high level of media attention. The overall market sentiment index is currently in extremely bullish zone.
Fundamental Analysis of T-Mobile US Inc (TMUS)
T-Mobile US Inc (TMUS) is in the Telecommunications Services industry. Its latest annual revenue is $88.31B, ranking 4 in the industry. The net profit is $10.99B, ranking 4 in the industry. Company Profile
Over the past month, multiple analysts have rated the company as Buy, with an average price target of $240.60, a high of $310.00, and a low of $169.00.
More details about T-Mobile US Inc (TMUS)
Company Specific Risks:
- Emerging Satellite Competition Disruption: Recent price target revisions by Wall Street brokerages including Scotiabank highlight heightened disruption risks from SpaceX acquiring 800 MHz spectrum to expand direct-to-cell capabilities, raising institutional concerns over long-term spectrum valuation and carrier market share.
- Premium Valuation Vulnerability: T-Mobile continues to trade at a premium multiple relative to telecom peers Verizon and AT&T, leaving the stock vulnerable to valuation compression as postpaid subscriber growth normalizes from post-merger high rates.
- Broadband Convergence Footprint Limitations: Analysts flag structural weaknesses in T-Mobile's converged broadband strategy, which relies heavily on Fixed Wireless Access and joint-venture fiber rather than an extensive owned wireline fiber network, exposing it to potential capacity constraints against integrated competitors.
- Executive Transition Execution Risk: Recent Form 8-K filings detail the planned succession of Chief Financial Officer Peter Osvaldik by incoming CFO Jessica Uhl, introducing leadership transition risk during a period of elevated debt issuance and complex capital allocation programs.
Recommended Articles


