


Itau Unibanco Holding SA Stock (ITUB) Moved Down by 3.30% on Oct 7: What Signal Does It Send?
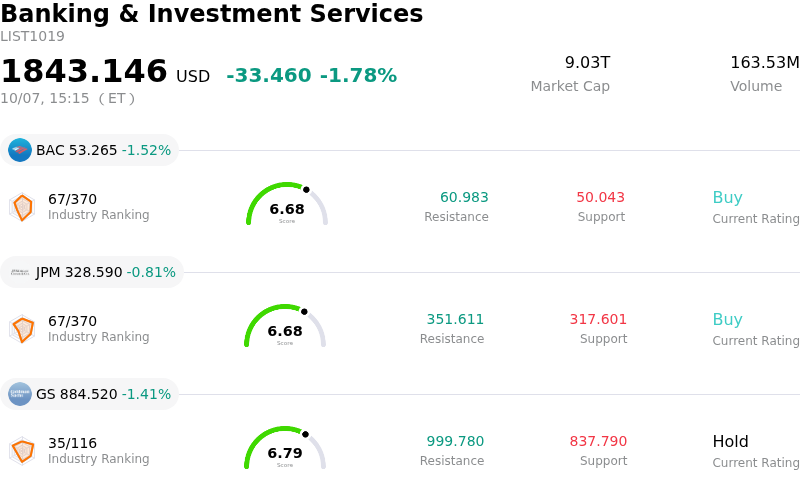
Itau Unibanco Holding SA (ITUB) moved down by 3.30%. The Banking & Investment Services sector is down by 1.78%. The company underperformed the industry. Top 3 stocks by turnover in the sector: Bank of America Corp (BAC) down 1.52%; JPMorgan Chase & Co (JPM) down 0.80%; Goldman Sachs Group Inc (GS) down 1.41%.
What is driving Itau Unibanco Holding SA (ITUB)’s stock price down today?
The downward momentum in Itaú Unibanco Holding S.A. reflects a classic technical consolidation following a powerful multi-day rally. The stock had recently expanded to new annual peaks, propelled by a sharp re-rating across Brazilian financial assets and positive investor sentiment surrounding upcoming corporate earnings. However, this rapid upward movement pushed short-term technical indicators into heavily overbought territory. As the stock reached technical resistance, institutional market participants and tactical traders initiated profit-taking, generating heightened intraday volatility as supply temporarily outweighed buying demand.
Beyond short-term profit-taking, broader macroeconomic sensitivities in Brazil continue to influence trading sentiment across the financial sector. Market focus has re-centered on domestic fiscal conditions, where elevated government debt trajectories and restrictive monetary policy settings create a complex operating backdrop. While high interest rates support net interest margins for tier-one Brazilian lenders, prolonged tight financial conditions raise questions regarding loan growth momentum and broader economic expansion, leading international investors to pause and reassess risk premiums in emerging market financials.
From a structural perspective, Itaú Unibanco maintains strong fundamental balance sheet health, characterized by high profitability ratios, a robust deposit franchise, and consistent capital returns to shareholders. The current intraday retracement appears driven primarily by macro-level risk management and position rebalancing rather than institutional credit concerns. Investors will likely look to upcoming earnings disclosures and domestic fiscal policy updates to determine whether the pull-back represents a temporary pause within a broader structural trend.
Technical Analysis of Itau Unibanco Holding SA (ITUB)
Technically, Itau Unibanco Holding SA (ITUB) shows a MACD (12,26,9) value of 0.374, indicating a buy signal. The RSI at 71.928 suggests buy condition and the Williams %R at 16.863 suggests overbought condition. Please monitor closely.
Fundamental Analysis of Itau Unibanco Holding SA (ITUB)
Itau Unibanco Holding SA (ITUB) is in the Banking & Investment Services industry. Its latest annual revenue is $30.79B, ranking 15 in the industry. The net profit is $8.02B, ranking 13 in the industry. Company Profile
Over the past month, multiple analysts have rated the company as Buy, with an average price target of $9.65, a high of $10.20, and a low of $9.10.
More details about Itau Unibanco Holding SA (ITUB)
Company Specific Risks:
- Political Event Volatility and Runoff Reversal Risk: The sharp multi-year high surge driven by first-round Brazilian election results exposes the stock to immediate profit-taking and severe downside volatility if polling sentiment shifts ahead of the late-October presidential runoff.
- Valuation Cap Against Wall Street Price Targets: After clearing record highs above $10.15, the shares have eclipsed the consensus 12-month analyst price target of $10.00 and stretched price-to-book valuation metrics, severely capping further re-rating upside.
- Regulatory Fee Compression from Central Bank Initiatives: Central Bank of Brazil regulations—most notably mandatory open banking protocols and fee-free Pix payment structures—continue to erode traditional transactional service fees and compress core non-interest margins.
- Macroeconomic Credit Tightening and Fintech Disruption: Mounting household debt strains across Brazil have forced incumbent banks to curtail higher-yield retail lending, heightening execution risk as market share shifts to lower-cost digital financial platforms.
Recommended Articles


