


NRG Energy Inc Stock (NRG) Moved Up by 7.10% on Oct 6: A Full Analysis
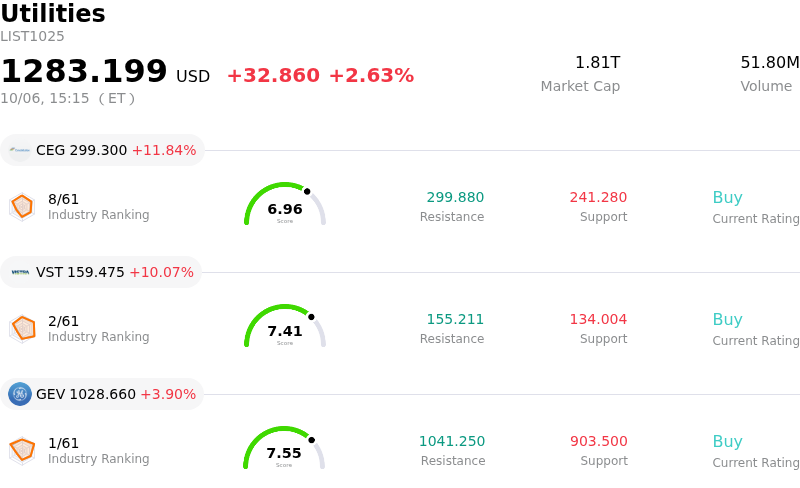
NRG Energy Inc (NRG) moved up by 7.10%. The Utilities sector is up by 2.63%. The company outperformed the industry. Top 3 stocks by turnover in the sector: Constellation Energy Corp (CEG) up 11.84%; Vistra Corp (VST) up 10.07%; Ge Vernova Inc (GEV) up 3.90%.
What is driving NRG Energy Inc (NRG)’s stock price up today?
NRG Energy recorded a strong upward move as market sentiment turned decisively positive, driven by emerging activist investor engagement and broader industry momentum across independent power producers. Reports of fresh activist involvement aimed at encouraging strategic refinements, operational efficiency, and capital allocation discipline spurred investor optimism regarding a potential valuation re-rating. Market participants frequently view activist campaigns as constructive catalysts that can accelerate management efforts to unlock shareholder value and optimize asset portfolios.
Sector-specific dynamics provided additional tailwinds for the power generation space. Broad investor enthusiasm was reinforced by major capital raises within power infrastructure, highlighting the premium placed on generation capacity required to sustain expanding artificial intelligence data center workloads. NRG's ongoing execution of its Bring Your Own Power strategy, which features long-dated contracted capacity payments with major hyperscalers and key industrial customers, continues to strengthen its multi-year cash flow visibility while mitigating exposure to volatile short-term wholesale electricity prices.
From an institutional research perspective, the rally represents a rebound following recent broader sector pullbacks tied to regulatory reviews in regional capacity markets. While long-term fundamentals remain supported by growing Texas and PJM grid power demand, investors will closely monitor execution on leverage reduction targets following historical asset integrations. Key operational metrics to evaluate moving forward include construction progress on new natural gas capacity, disciplined balance sheet management, and the timely execution of contracted data center projects.
Technical Analysis of NRG Energy Inc (NRG)
Technically, NRG Energy Inc (NRG) shows a MACD (12,26,9) value of 0.895, indicating a neutral signal. The RSI at 47.923 suggests neutral condition and the Williams %R at 42.414 suggests buy condition. Please monitor closely.
Fundamental Analysis of NRG Energy Inc (NRG)
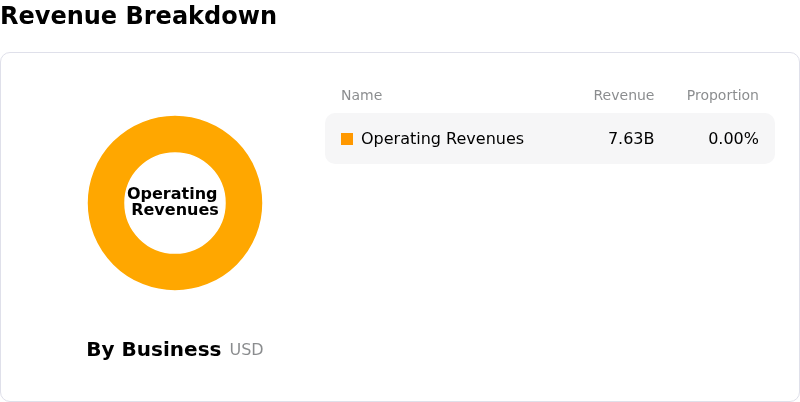
NRG Energy Inc (NRG) is in the Utilities industry. Its latest annual revenue is $30.70B, ranking 4 in the industry. The net profit is $797.00M, ranking 28 in the industry. Company Profile
Over the past month, multiple analysts have rated the company as Buy, with an average price target of $180.16, a high of $221.00, and a low of $108.44.
More details about NRG Energy Inc (NRG)
Company Specific Risks:
- Regulatory Backstop Suspension: The Federal Energy Regulatory Commission's unexpected five-month hold on PJM Interconnection's reliability backstop capacity procurement has created acute regulatory uncertainty, directly threatening near-term capacity revenue streams.
- Activist Campaign Instability: Intensified activist investor intervention targeting strategy and capital allocation has injected severe operational volatility and governance uncertainty, driving wide intraday price swings.
- Earnings Drag and Target Downgrades: Q2 earnings missed sell-side estimates due to higher supply costs and unseasonal weather, leading major institutional analysts to cut price targets and lower near-term margin expectations.
- Leverage and Integration Exposure: Substantial debt accrued from large-scale acquisitions, including the LS Power assets, leaves the balance sheet vulnerable to integration friction and elevated capital costs.
Recommended Articles


