


The Stock Market Is Repeating a Pattern Seen Only Once Since 1871. Here's What History Says Comes Next.
Key Points
As stock prices climb higher, there's renewed concern about a stock market bubble.
One market metric is showing parallels to the dot-com era, which could be a warning sign.
The right investing strategy will be key to surviving a potential bear market.
- Motley Fool Issues Rare "Total Conviction" Buy Alert ›
The stock market has been booming lately, with both the S&P 500 (SNPINDEX: ^GSPC) and the Nasdaq Composite (NASDAQINDEX: ^IXIC) notching new all-time highs this month.
But the market will have to work hard to maintain this winning streak. Bond yields are reaching their highest levels in decades, pushing up borrowing costs, and high oil prices are also keeping inflation elevated.
Missed AI’s "Act 1"? Act 2 Could Be 15x Bigger. Most investors think they missed the AI boat because they didn't buy Nvidia in 2005. But according to our analysts, we’re only at the end of "Act 1"—the R&D phase. "Act 2" is the global rollout. Continue »
Amid all of these headwinds, the market has been sending a quiet warning signal over the past few months that echoes the dot-com bubble of the early 2000s. Here's what history says investors can expect.

Image source: Getty Images.
The stock market could be entering bubble territory
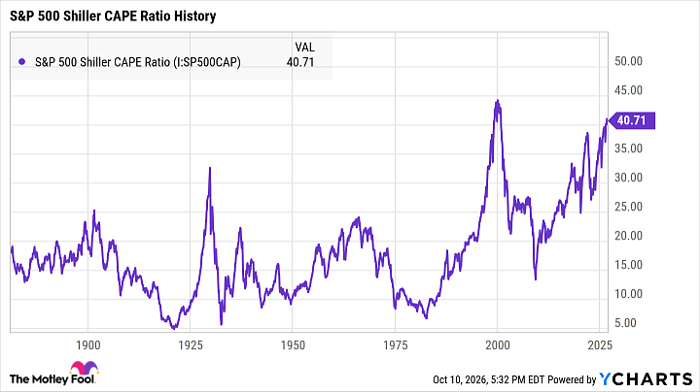
As company valuations climb, many investors are growing increasingly concerned that the market is in a bubble. One metric that has been sounding the alarm in recent months is the S&P 500 Shiller Cyclically Adjusted Price-to-Earnings (CAPE) Ratio, which provides a snapshot of the market's valuation over time.
The higher this ratio climbs, the more likely it is that the broader market is overvalued. It also has an inverse relationship with stock prices, as prices tend to fall after this metric climbs.
Dating to 1871, the CAPE ratio has a strong track record of anticipating bear markets. It saw a major spike in 1929, for example, just before the Great Depression. Most recently, it surged to the high 30s in late 2021, just before the 2022 bear market began. But its most severe warning happened in 1999.
S&P 500 Shiller CAPE Ratio data by YCharts
In January 1999, the ratio surpassed 40 for the first time in history. It stayed in the 40s that entire year, peaking at around 44 in December. Just a few months later, in March 2000, the dot-com bubble popped, and stocks crashed into a bear market that would last over two years.
Right now, this metric is repeating a similar pattern. It reached 40 again in May of this year, and it's remained above that level ever since. While that doesn't necessarily mean another bubble burst is looming, it does suggest that the market is historically expensive right now.
What history says is coming next
Nobody can predict what the market will do in the near term, but history can offer a clear answer as to where stocks are headed over time -- and it's incredibly promising.
So far, the market has survived every single hurdle it's ever faced. In fact, it's helped millions of investors build life-changing wealth despite severe short-term volatility.
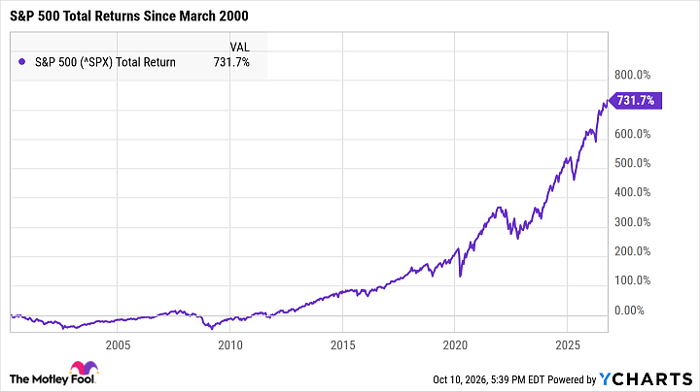
For example, throughout the dot-com bear market, the S&P 500 lost nearly half of its value. Yet since March 2000, the index has earned total returns of more than 700%. In other words, if you'd invested $10,000 in an S&P 500 index fund immediately before the dot-com bubble popped, you'd have more than $83,000 by today.
^SPX data by YCharts
To be clear, the market's short-term performance can be incredibly volatile. And if you're investing in low-quality stocks, your portfolio may not recover from a recession or bear market. During the dot-com bubble, for instance, many overvalued tech stocks crashed and never bounced back.
However, as long as you're investing in companies with strong fundamentals, history proves time and again that your portfolio is highly likely to thrive over time. By staying invested despite volatility, you can set yourself up for lucrative long-term gains.
Should you buy stock in S&P 500 Index right now?
Before you buy stock in S&P 500 Index, consider this:
The Motley Fool Stock Advisor analyst team just identified what they believe are the 10 best stocks for investors to buy now… and S&P 500 Index wasn’t one of them. The 10 stocks that made the cut could produce monster returns in the coming years.
Consider when Netflix made this list on December 17, 2004... if you invested $1,000 at the time of our recommendation, you’d have $379,123!* Or when Nvidia made this list on April 15, 2005... if you invested $1,000 at the time of our recommendation, you’d have $1,408,822!*
Now, it’s worth noting Stock Advisor’s total average return is 950% — a market-crushing outperformance compared to 215% for the S&P 500. Don't miss the latest top 10 list, available with Stock Advisor, and join an investing community built by individual investors for individual investors.
See the 10 stocks »
*Stock Advisor returns as of October 12, 2026.
Katie Brockman has no position in any of the stocks mentioned. The Motley Fool has no position in any of the stocks mentioned. The Motley Fool has a disclosure policy.
Recommended Articles


