


EUR/USD (EURUSD) Moved Sharply on Oct 5: Are Central Bank Expectations Shifting?
EUR/USD (EURUSD) is down 0.58% at Oct 5 22:50(ET), now at $1.11867, with a 7-day down of 1.61%.
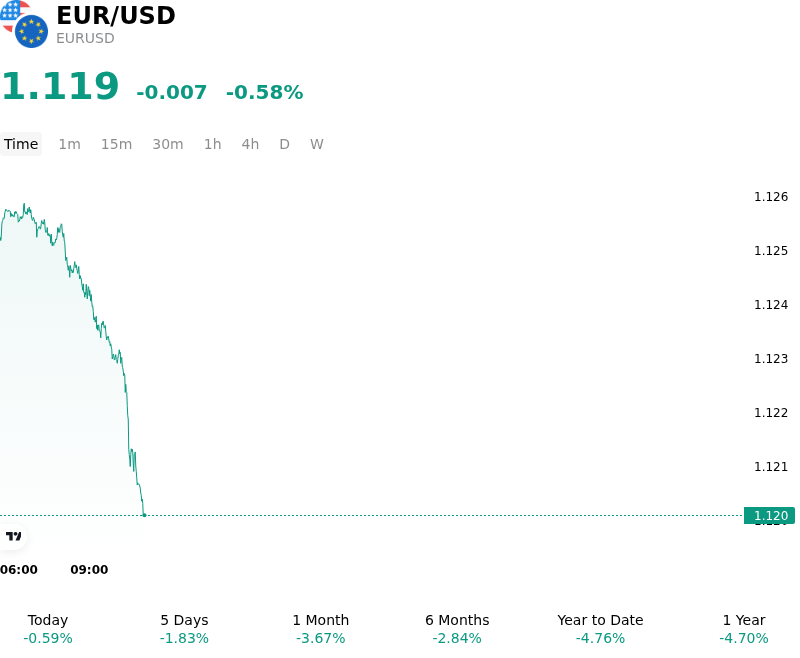
What is driving EUR/USD (EURUSD)’s stock price down today?
The sell-off in EURUSD reflects widening sovereign yield differentials and renewed demand for the US dollar, largely driven by persistent upward pressure on long-term US Treasury yields. Despite mixed economic headlines, elevated yields on US benchmark debt continue to bolster the dollar's carry advantage against European fixed-income instruments. Capital flows remain heavily skewed toward dollar-denominated assets as international investors respond to the relative yield premium available in the United States, placing structural downward pressure on the single currency.
At the same time, the euro faces mounting headwinds from sub-par growth fundamentals across the Eurozone and persistent fiscal strains in key member states. Widening sovereign bond spreads within the monetary union have heightened concerns over fiscal sustainability and regional growth divergence. With forward-looking sentiment indicators remaining subdued, market participants anticipate that the European Central Bank will maintain a cautious monetary stance, limiting its scope for further rate increases and dampening enthusiasm for euro exposure.
From an institutional positioning perspective, global risk aversion and ongoing geopolitical uncertainty have reinforced defensive demand for the US dollar. The greenback continues to benefit from its dual role as a high-yielding asset and a primary safe-haven vehicle. Unless upcoming macroeconomic releases provide a sufficient catalyst to narrow yield differentials or alleviate fiscal concerns within the Eurozone, the broader macro environment favors continued euro underperformance against the dollar in the near term.
Technical Analysis of EUR/USD (EURUSD)
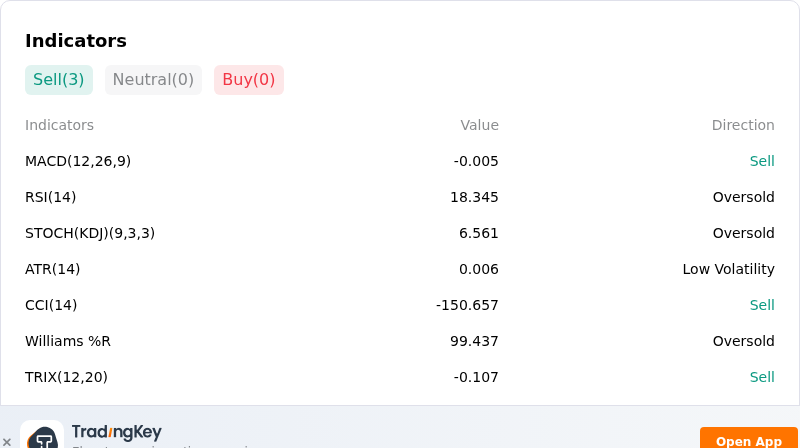
Technically, EUR/USD (EURUSD) shows a MACD (12,26,9) value of -0.005, indicating a sell signal. The RSI at 18.345 suggests oversold condition and the Williams %R at 99.437 suggests oversold condition. Please monitor closely.
More details about EUR/USD (EURUSD)
Recent Events and Risks:
- French Fiscal Instability and Sovereign Yield Pressure: Escalating political friction surrounding France's draft budget has driven the French-German 10-year yield spread to multi-year highs, triggering sovereign debt concerns and encouraging capital flight out of the euro into safe-haven assets.
- Widening US-Eurozone Yield Differentials: Elevated US Treasury yields, bolstered by steady domestic economic data and elevated inflation expectations, maintain a strong interest rate differential advantage in favor of the US dollar over the euro.
- Eurozone Energy Supply Shock and Stagflation Threats: Surging energy prices driven by geopolitical supply disruptions continue to pressure European household purchasing power and corporate margins, reinforcing stagflation concerns across major bloc economies.
- Dovish ECB Policy Signals: Cautionary rhetoric from European Central Bank policymakers advocating a gradual approach to policy adjustment limits rate hike expectations, leaving the euro without adequate central bank support to counter USD strength.
Recommended Articles


